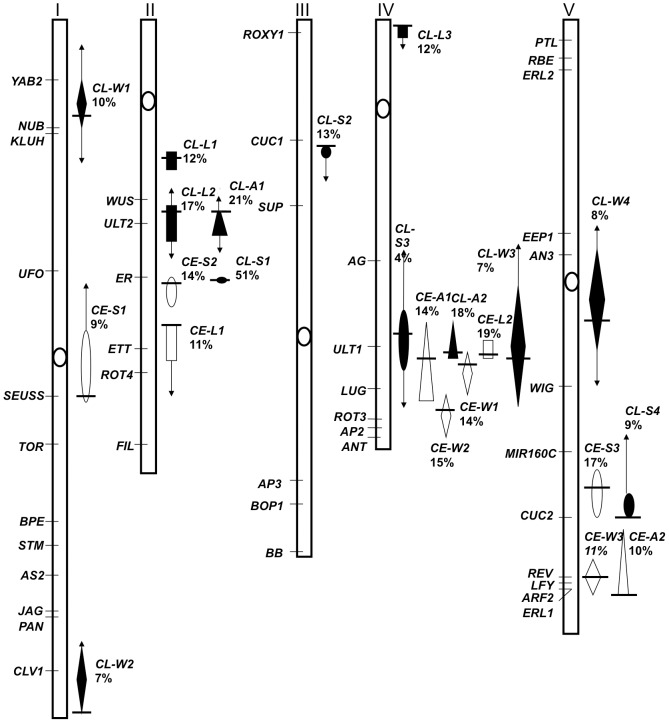
Figure 1. Chromosomal Locations of Quantitative Trait Loci (QTL) for Natural Variation in Petal Form in Arabidopsis thaliana.
The chromosomal location of identified QTLs is shown on the five Arabidopsis chromosomes. The location of several known floral or growth regulatory genes are indicated and the centromeres marked as open circles. QTLs identified using Columbia (Col-4)×Landsberg erecta (Ler) recombinant inbred lines are shown in black and named CL, and those identified from Columbia (Col-0)×Estland (Est) recombinant inbred lines are shown in white and named CE. Each QTL is indicated by a shape, with the extent of the shape indicating the 1-LOD support interval: triangle (area), rectangle (length), diamond (width), or oval (shape) and named as A, L, W, or S, respectively. The location of each QTL peak is marked with a black horizontal line and the 2-LOD support interval boundary is indicated by arrows. Where the 1-LOD and 2-LOD boundaries are the same for a QTL, no arrows are marked. Adjacent to each QTL the Percentage of Variance Explained (PVE) is noted.

