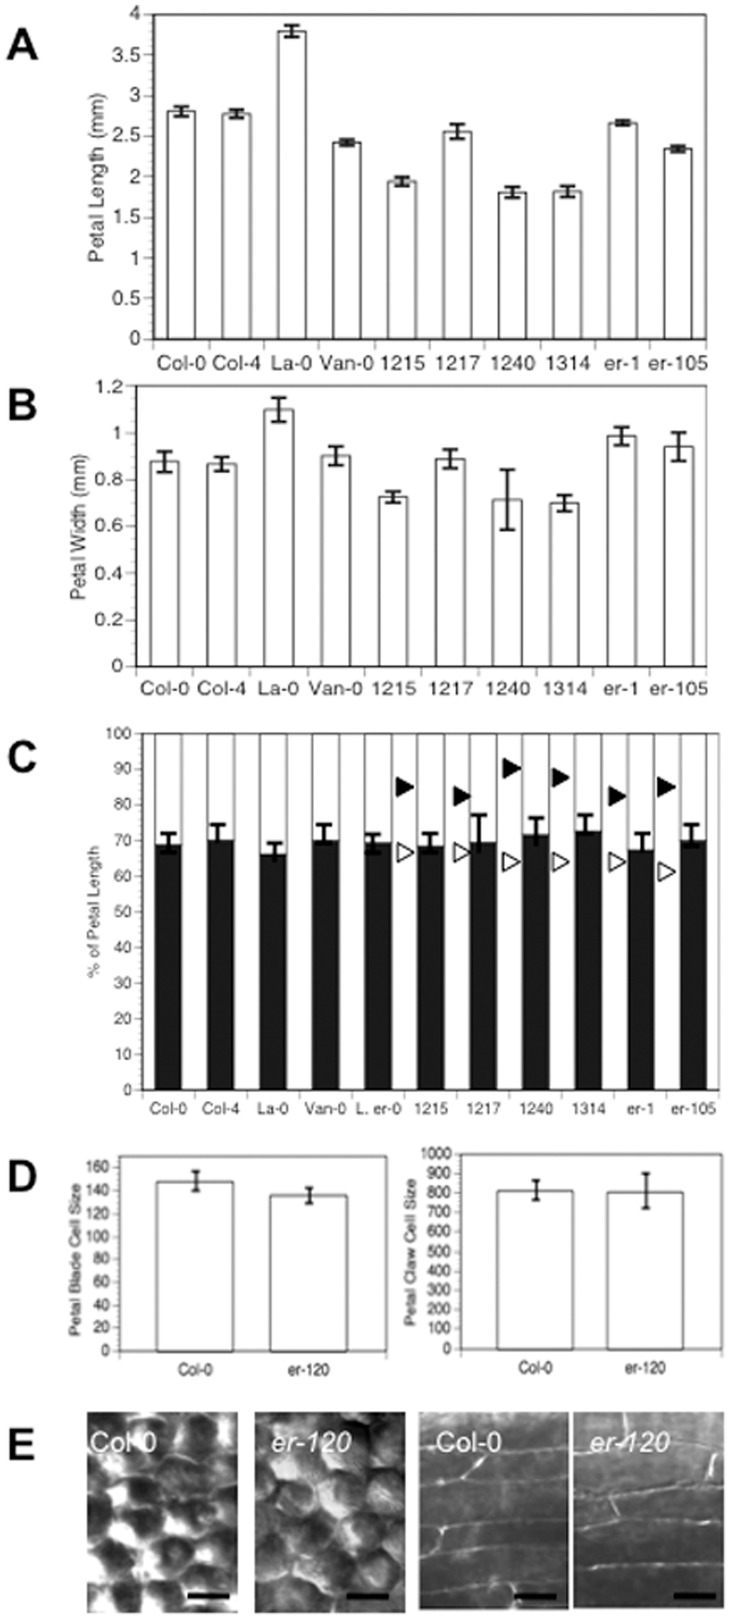
Figure 3. Petal Shape Differences Associated with Different ER Alleles Are Caused by Differences in Cell Proliferation.
(A) and (B) Histograms showing stage 13 petal lengths and widths. The error bars for all graphs represent the 95% confidence intervals. (C) Stacked bar chart showing the mean % of petal length for blade (white) and claw (black) for the lines indicated. The black arrowhead indicates where the blade/claw boundary would be located if the length change for that line was just due to changes in the blade, and the white arrowhead indicates where the blade/claw boundary would be located if the length change for that strain was just due to changes in the claw. (D) Average cell size in microns2 was calculated for the blade and the claw. A minimum of three regions on three petals were sampled for each measurement. (E) Sample petal stage 13 blade (left) and claw (right) cells for the genotypes indicated. Scale bars = 20 µm.

