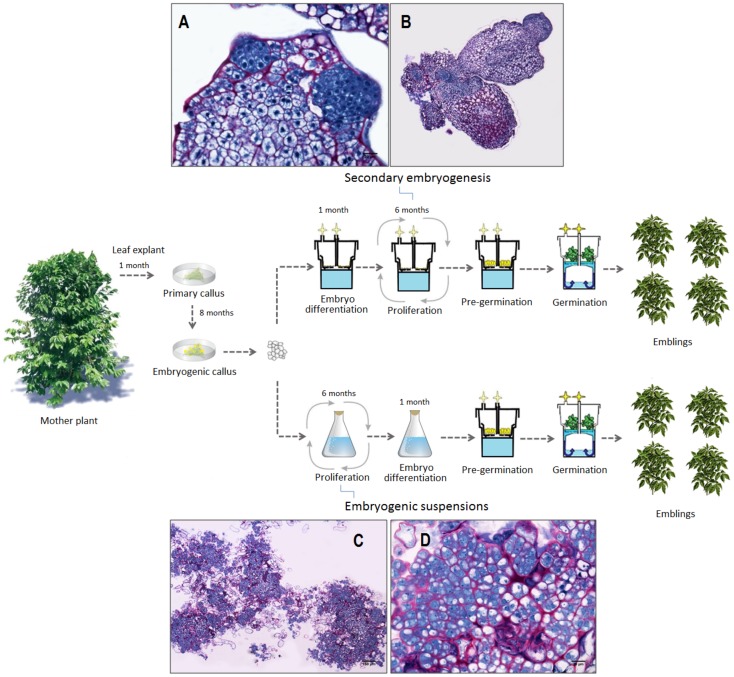
Figure 1. Schematic representation of two somatic embryogenesis processes applied at the industrial level.
The first somatic embryogenesis process (upper section of the flow diagram) involved a proliferation step based on secondary embryogenesis in RITA® temporary immersion bioreactors (photos 1A, 1B). The second process (lower section of flow diagram) included a proliferation step based on embryogenic suspensions (photos 1C, 1D). 1A, initial developmental stages of secondary embryos at the root pole of primary somatic embryos; 1B, clusters of primary and secondary embryos; 1C, clusters of embryogenic cells in suspension; 1D, embryogenic cells in suspension.

