
Figure 2. Phenotype analyses of CaZF overexpressing (CaZFOX) transgenic tobacco plants.
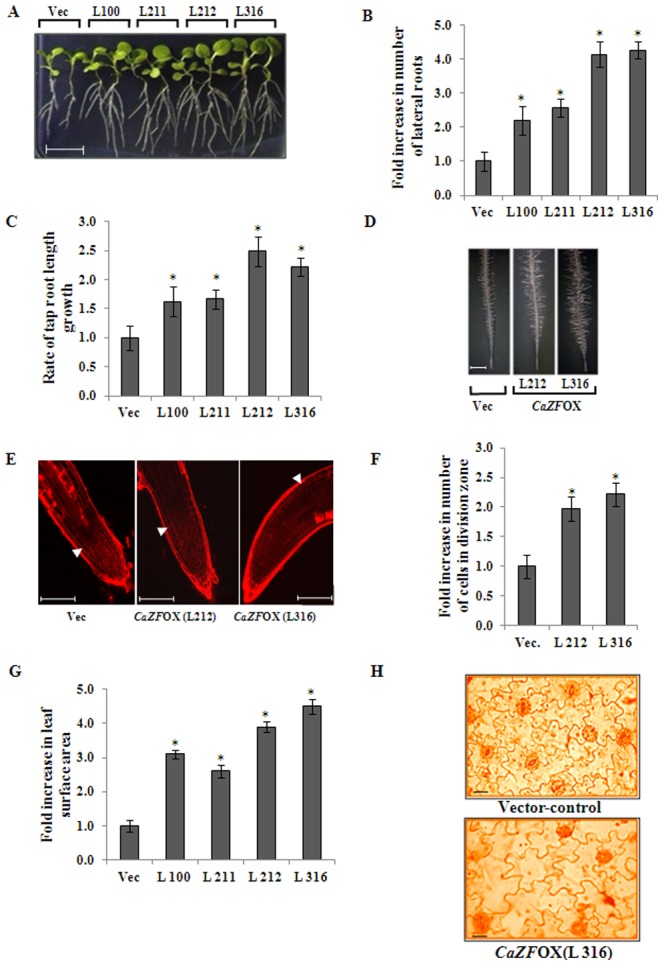
(A) Tobacco seedlings of four independent T3 homozygous lines harboring CaZF (CaZFOX, L100, L211, L212, L316) or empty vector (Vec) were grown vertically under control conditions (½ MS, 25°C) for 15 days. Scale bar is 1 cm. (B) Comparison of number of lateral roots, and (C) fold increase in rate of taproot length growth of vector-control and CaZFOX seedlings. The means of three measurements of thirty seedlings of each line are shown. (D) Comparison of root hair of 6-day-old vector-control and CaZFOX (L212 and L316) tobacco seedlings. Scale bar is 1 mm. (E) Confocal imaging of root apices of 6 d-old vector-control and CaZFOX tobacco seedlings stained with fluorescent dye Propidium iodide (PI) at equal magnification. Arrow marks the start of elongation zone. Scale bar is 100 µm. (F) Graphical representation of fold increase in number of dividing cells in the meristematic zone of roots of 6-day-old CaZFOX plants is presented in the right panel. (G) Comparison of surface area of the third (from the bottom) leaves of 15-day-old vector-control and CaZFOX plants. (H) Epidermal peels from the ventral surface of the middle lamina of the vector control and transgenic (CaZFOXL316) leaves showing cell size. Scale bar is 10 µm. The error bars indicate the standard deviation (SD). * indicates significant differences in comparison with the vector-control (Vec) at p<0.005.