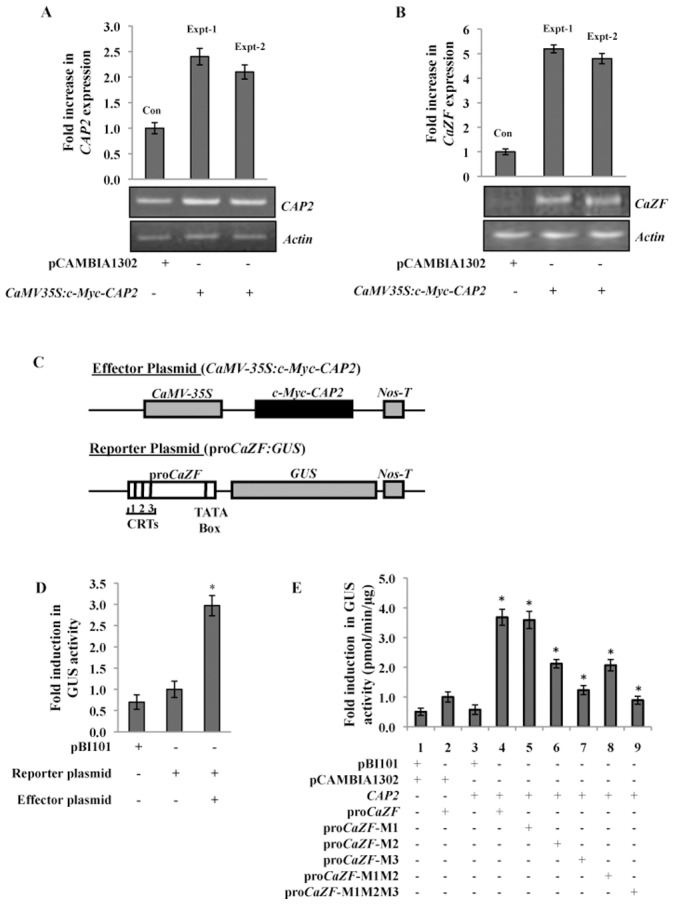
Figure 5. Activation of CaZF-promoter by CAP2 in plant cell.

(A, B) Enhancement of CaZF expression by transient overexpression of CAP2 in chickpea. Young leaves of 10-day-old chickpea seedlings were transformed with CaMV35S:c-Myc-CAP2 by particle bombardment. Chickpea leaves were harvested after 48 h of incubation. Leaves transformed with empty vector (pCAMBIA1302) were taken as control (Con). 2 µg of total RNA was reverse transcribed for cDNA preparation. CAP2 (A) and CaZF (B) expression was analyzed in the control and experimental tissues by semi-quantitative RT-PCR (27 cycles) and qReal-Time PCR. The expression level of Actin gene was taken as an internal control. Results from two biological replicates (Expt-1, Expt-2) are shown. (C) Schematic diagram of the effector and reporter constructs used in the co-transfection experiments. Full-length CAP2 cDNA was fused with 2Xc-Myc at N-terminus and cloned under CaMV-35S promoter in pCAMBIA1302 to construct effector plasmid. proCaZF with three CRTs was fused with GUS gene in pBI101 to construct reporter plasmid. (D) Both the effector and reporter plasmids as mentioned in the figure were co-introduced in to tobacco leaf explants by Agrobacterium-mediated transformation and antibiotic-selected shootlets were used for the GUS assay. Expression of kanamycin resistance gene (NPT II) as assessed by qRT-PCR was used for normalization of results in the transformed shoot-lets. (E) The effector and reporter constructs were co-introduced into tobacco BY2 protoplasts as mentioned in the table. CAP2 stands for the effector plasmid and pro-CaZF stands for the reporter plasmid. pro-CaZF (M1–M3) stands for the reporter plasmids with mutations in CRT1-CRT3 in pro-CaZF. GUS activity was measured fluorometrically after 48 h of transformation. The empty vectors without CAP2 (pCAMBIA1302) or proCaZF (pBI101) were used as controls. Transfection efficiency of the CaMV-35S-EYFP1 plasmid included in protoplast experiment was used for normalization. The error bars indicate the standard deviation (SD). * indicates significant differences in comparison to the controls at p<0.005.
