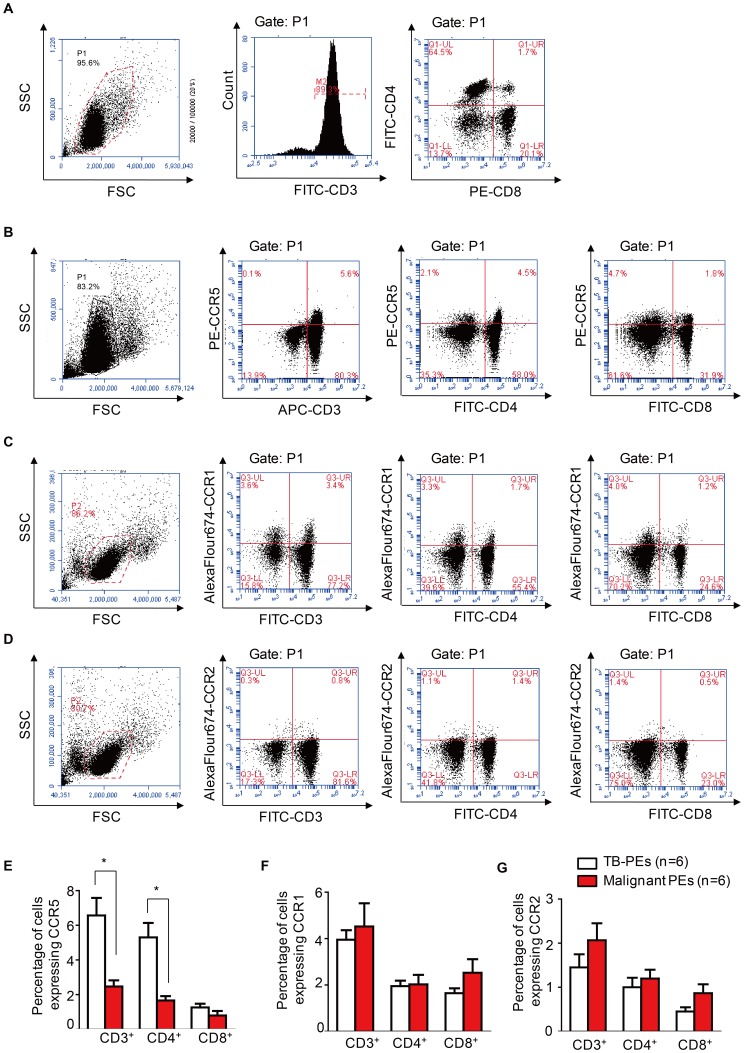
Figure 2. Higher percentage of CCR5-expressing CD4+ T cells in TB-PEs.
(A) Representative FACS detection of CD3+, CD4+ and CD8+ cells in PEs from TB patients. (B–D) Representative FACS detection of the expression of CCR5(B), CCR1 (C) or CCR2 (D) on CD3+, CD4+ and CD8+ cells from TB-PEs. (E–G) Graph shows the comparison of the percentage of CCR5 (E), CCR1 (F) or CCR2 (G) expressing CD3+,CD4+ and CD8+ cells between TB-PEs and malignant PEs (n = 6). All the fluorescent antibodies are purchased from ebioscience (San Diego, CA). The fluorescent antibodies are used according to the manual.*, p<0.05

