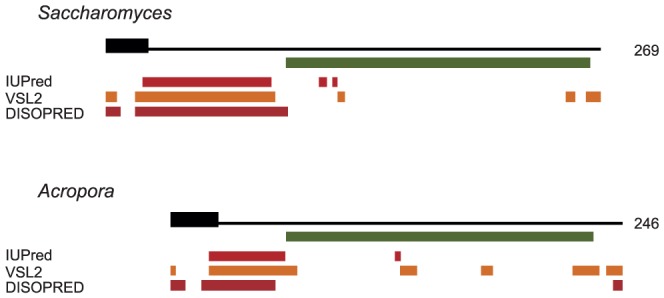
Figure 2. Domain organization for the S.cerevisiae and A.millepora Mgm101p sequences.

The thick black line represents the predicted mitochondrial target signal. The green bar identifies the experimentally determined core region for S. cerevisiae and the corresponding region determined from the sequence alignment for A. millepora. The orange bars represent predicted disordered regions. Disorder predictions were carried our using three independent methods, IUPred, PONDR VSL2, and DISOPRED2. The sequences were aligned so that the beginning of the core region is in the same vertical position.
