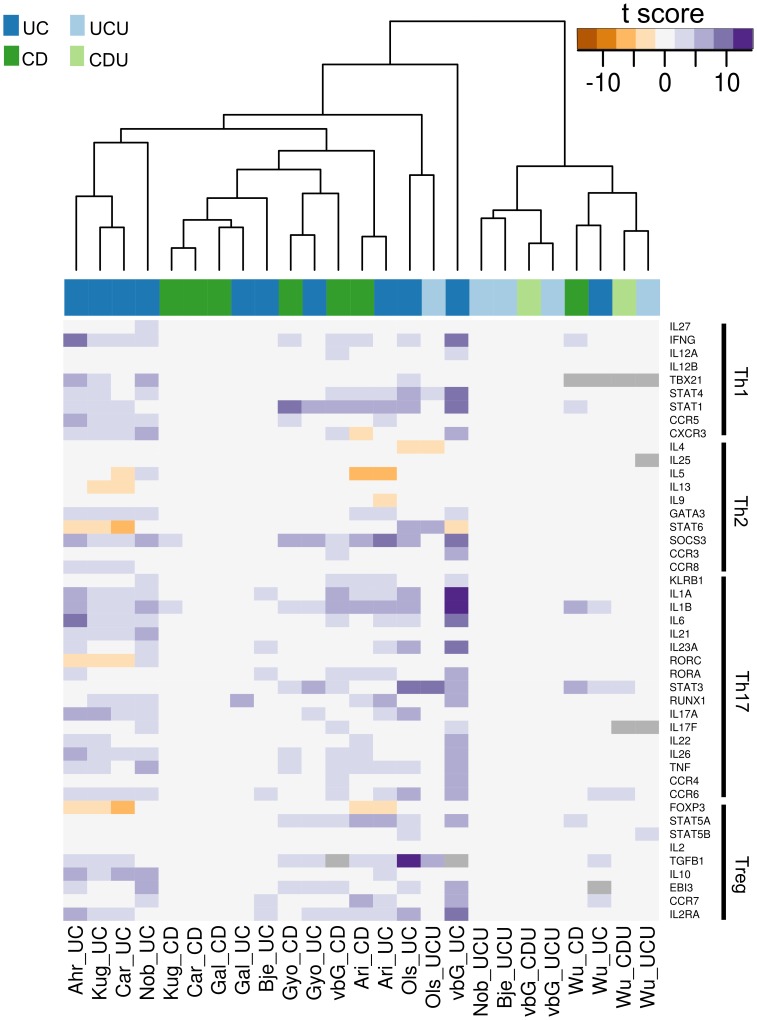
Figure 4. T helper cell-associated genes.
The figure shows a heat map of t-scores (corrected p-val <0.05) for genes related to T helper cell differentiation and function. Figure S4 shows the same data with a no p-value cut-off. Genes are grouped in the Th sub-categories Th1, Th2, Th17 and Treg. Each column in the figure represents the result for one comparison against normal control, with sample source and test group given as column name. The connection between each column’s source abbreviation and its related dataset(s) and article(s) are given in table 2. Some sets lack measurements for certain genes, in which case a grey marking is used.

