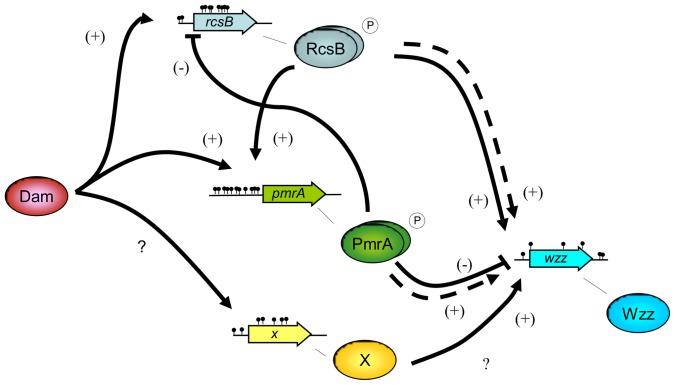
Figure 7. Schematic diagram of the proposed regulatory network of wzz gene expression in S. Enteritidis.
The regulatory cascade for wzz gene expression involves Dam methylation, PmrB/PmrA and RcsC/RcsD/RcsB two-component regulatory system and a putative third regulator (X). Proteins are indicated by ovals, whereas genes are symbolized by block arrows. Black dots indicate methylation sites (5′-GATC-3′ sequences). Dashed lines indicate direct interactions demonstrated in S. Typhimurium. Positive regulation (induction) is labeled with ↑ and (+), whereas negative regulation (repression) is labeled with ⊥ and (−). The question mark indicates a putative regulation.

