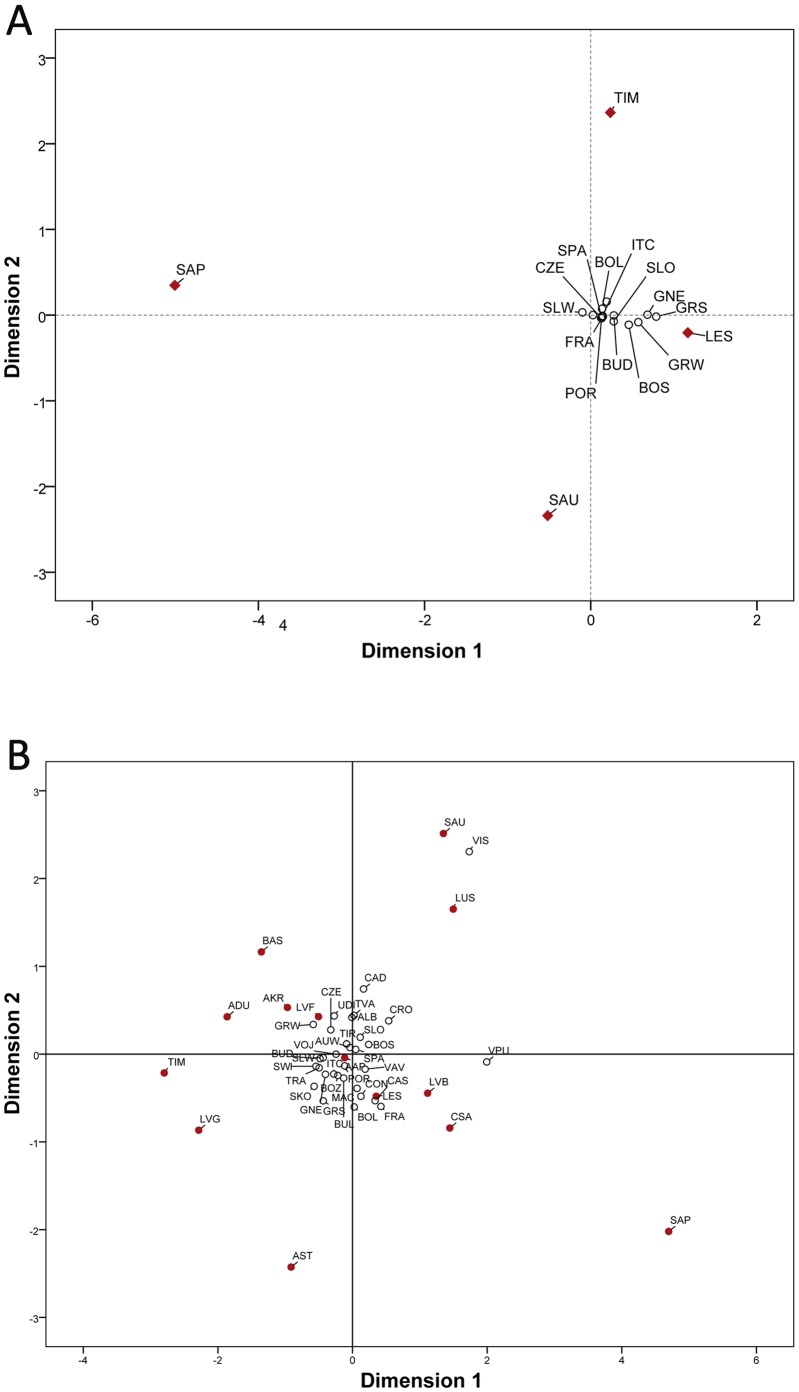
Figure 2. Multi-dimensional scaling plots of Fst genetic distances among European populations.
(a) Plot based on mtDNA HVR1 and HVR2 sequences (stress value = 0.067). Population acronyms: BOL, Bologna; BOS, Bosnia; BUD, Budapest; ITC, Central Italy; CZE, Czech Republic; FRA, France; LES, Lessinia; GNE, North-East Germany; POR, Portugal; SAP, Sappada; SAU, Sauris; SLO, Slovenia; GRS, South Germany; SWI, South-West Switzerland; SPA, Spain; TIM, Timau; VOJ, Vojvodina; AUW, West Austria; GRW, West Germany; SLW, West Slovakia (References in Table S1); (b) Plot based on mtDNA HVR1 sequences only (stress value = 0.173). Populations acronyms as in Table S2. Linguistic and/or geographic isolates are marked in red.

