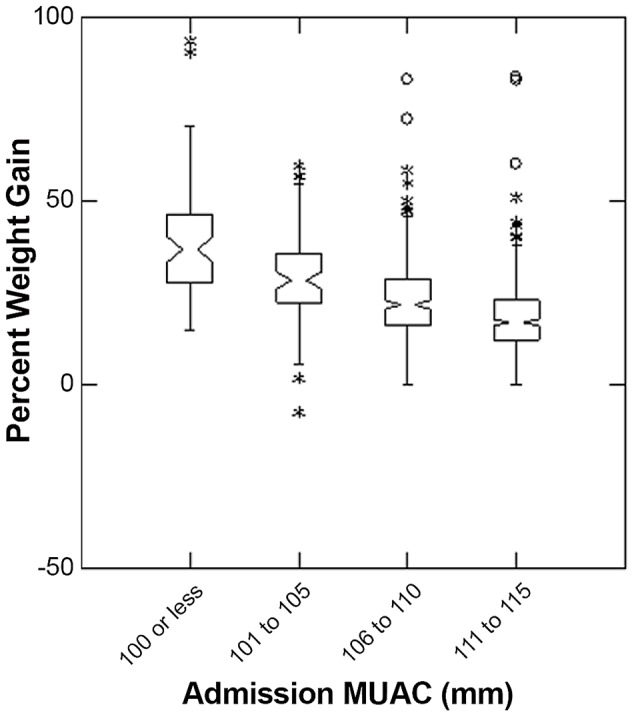
Figure 4. Percent Weight Gain by categories of MUAC on admission to Outpatient Therapeutic Program.

The box extends between the upper and lower quartiles, the line in the box marks the position of the median, the notches around the median show the extent of an approximate 95% confidence for the position of the median. The whiskers extend to 1.5 times the interquartile distance above and below the upper and lower quartiles, and the asterisks mark the positions of points more extreme than the range of values covered by the whiskers.
