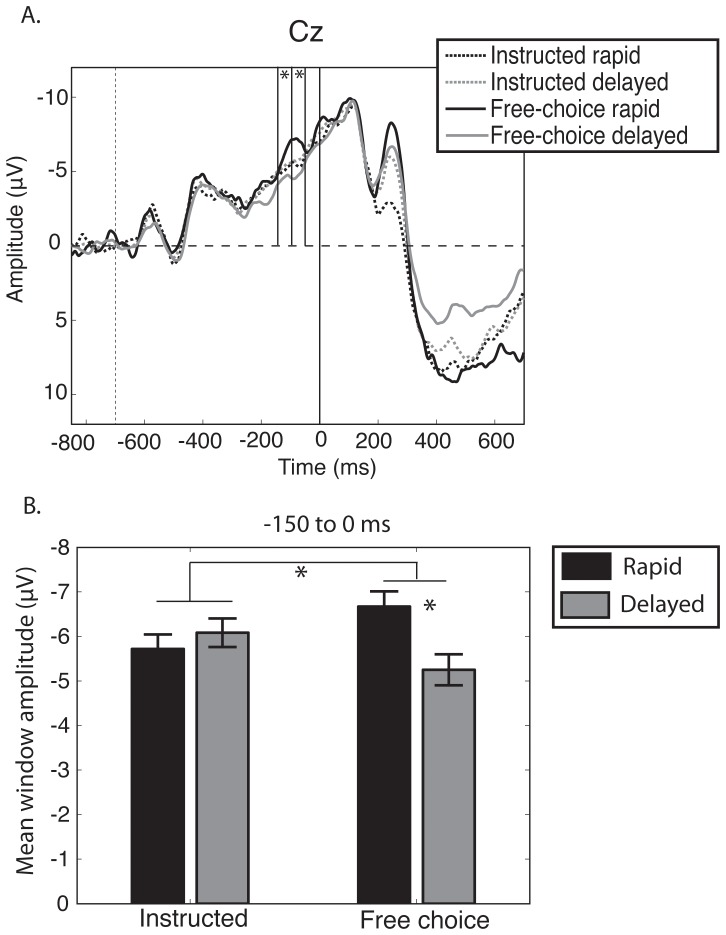
Figure 2. ERPs time locked to the instruction cue.
A. Averaged CNV amplitude in electrode Cz for the four main conditions, time locked to the appearance of the instruction cue (time 0 corresponds to the onset of the instruction cue). Note the difference in CNV amplitude between two free-choice rapid and delayed trials (solid lines), but no difference in CNV amplitude between instructed choice rapid and delayed trials (dashed lines). Asterisks indicate a significant ANOVA interaction (F test, p<0.05, uncorrected). Vertical dashed line at −700 ms indicates onset of warning signal and the end of baseline period (−850 to −700 ms). B. mean CNV amplitudes for the time window between −150 and 0 ms electrode Cz. Asterisk shows a significant difference (t-test, p<0.05, two tails, uncorrected).

