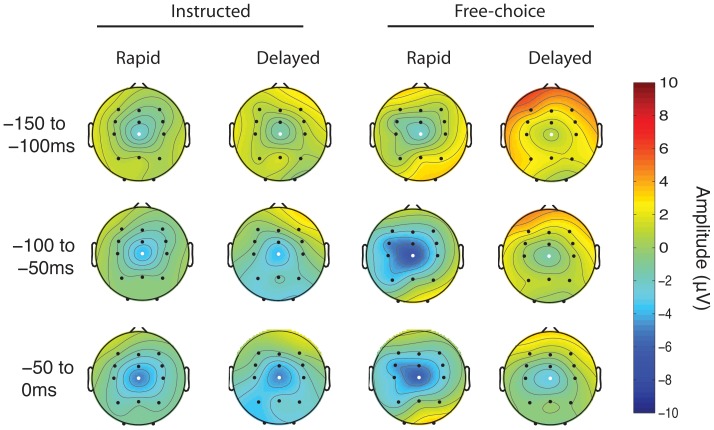
Figure 3. Topographical plot of ERP amplitude before the instruction cue.
Topographical distribution of the CNV component for each of the four main conditions, averaged over three time windows selected for analysis. White highlight shows electrode Cz, from which the mean time window amplitudes were obtained for statistical analyses.

