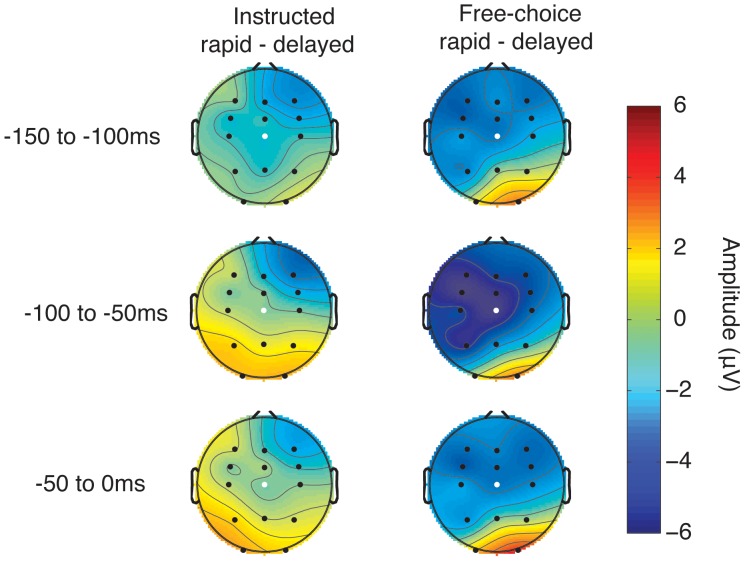
Figure 4. Differential topographical plots of ERPs.
Topographical plots of the difference in brain activity between rapid and delayed trials. Depicted values are averaged amplitudes over 50 ms time windows. Note stronger difference in free-choice than in instructed conditions. White highlight shows electrode Cz, from which the mean time window amplitudes were obtained for statistical analyses.

