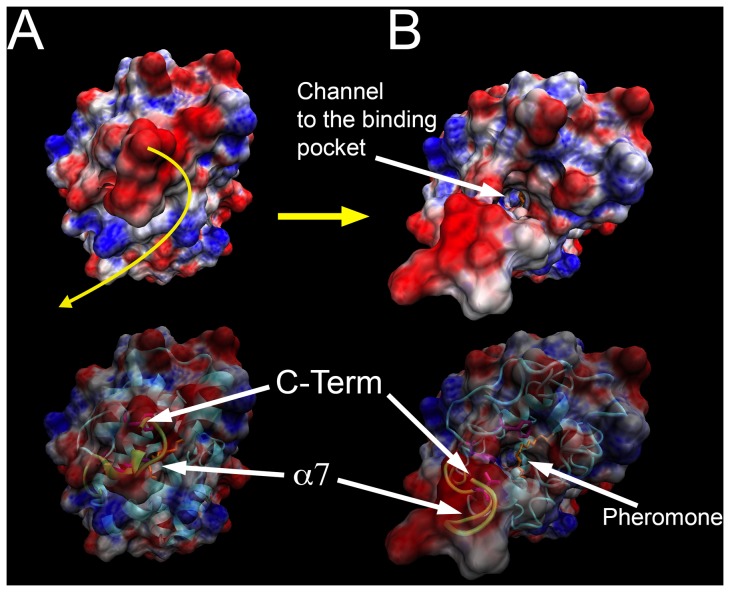
Figure 7. Molecular dynamics revealing the channel to the binding pocket at pH 7.0 along with the electrostatic surface properties.
A) MD at t = 0 ps; B) MD at t = 12.5 ps. The motion of the helix α7 is displayed in yellow. Electrostatic calculations are represented by blue for positive charge and red for negative charge with unit +5/−5 kT/e. Electrostatic calculations were done with APBS V1.2.1 and rendered with both VMD V1.8.7 and PyMOL V1.2 [21], [22].

