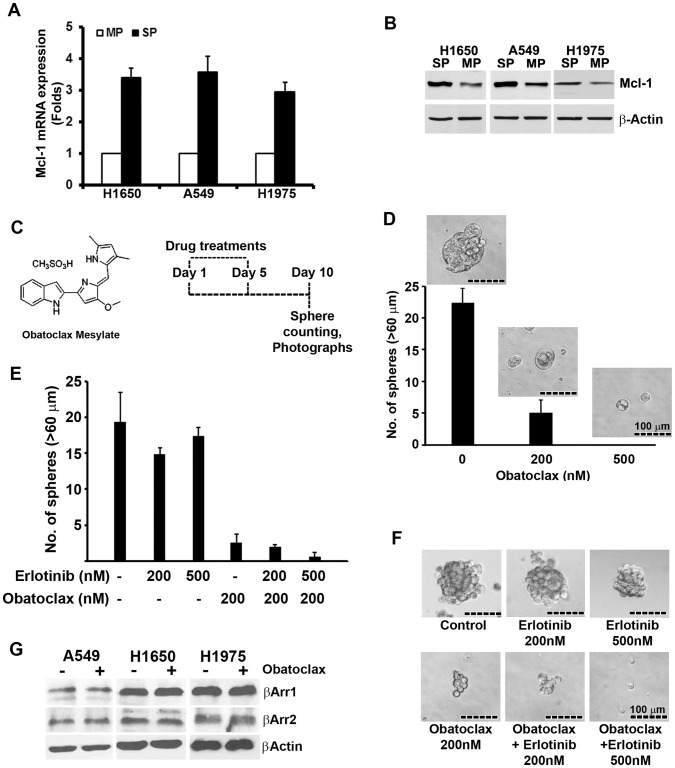
Figure 5. Mcl-1 regulates the self-renewal of SP cell.
(A, B) Relative expression of Mcl-1 was examined at mRNA and protein levels for indicated cell lines by RT-PCR and western blot analysis. (C) Structure of Obataoclax and its treatment schedule is represented. (D) H1650-SP cells were sorted and plated for self-renewal assay in the presence or absence of Obatoclax at indicated concentration. Average number of spheres generated per well from 1000 cells is plotted (mean±SD). Phase contrast microscopy images of the spheres in presence or absence of drugs are presented. (E) SP cells were sorted from erlotinib resistant H1975 cell line and plated for self-renewal assay in the presence or absence of indicated drugs. Average number of spheres generated per well from 1000 cells is plotted (mean±SD) and (F) phase contrast microscopy images of the spheres in presence or absence of drugs are presented. (G) Western-blot analysis of βArr1 and βArr2 in Obatoclax treated cells. Inhibition of Mcl-1 did not affect the expression of βArr1 and βArr2 in any of the cell lines tested.

