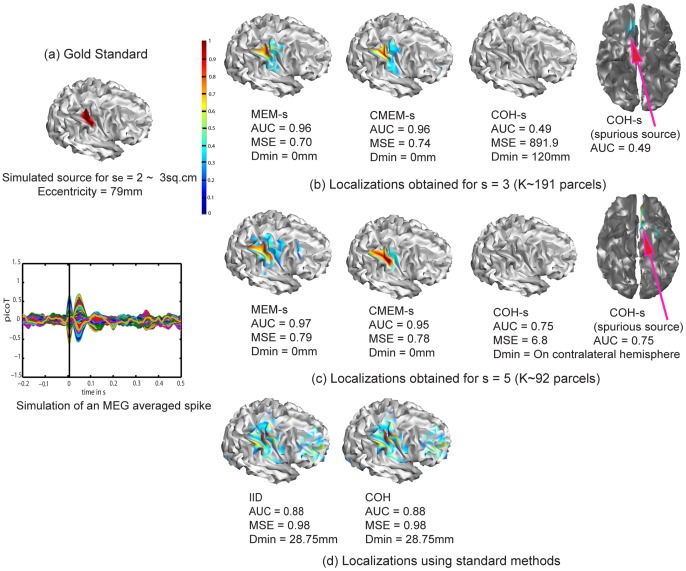
Figure 2. Qualitative assessment.
Visual analysis of source localization results together with Area Under the ROC curve (AUC) values for a simulated source of spatial extent se = 2 and eccentricity 79 mm. All source localization results are presented as the absolute value of the current density at the peak of the spike, normalized to its maximum activity and thresholded upon the level of background activity [51]. (a) Theoretical simulated source: spatial extent of the cortical source and associated simulated MEG signal for all MEG sensors (data being localized within a window of 20 time samples around the first peak of the spike). (b) Source localization results obtained for MEM-s, CMEM-s and COH-s at s = 3. (c) Source localization results obtained for MEM-s, CMEM-s and COH-s at s = 5. (d) Source localization results obtained for IID and COH.

