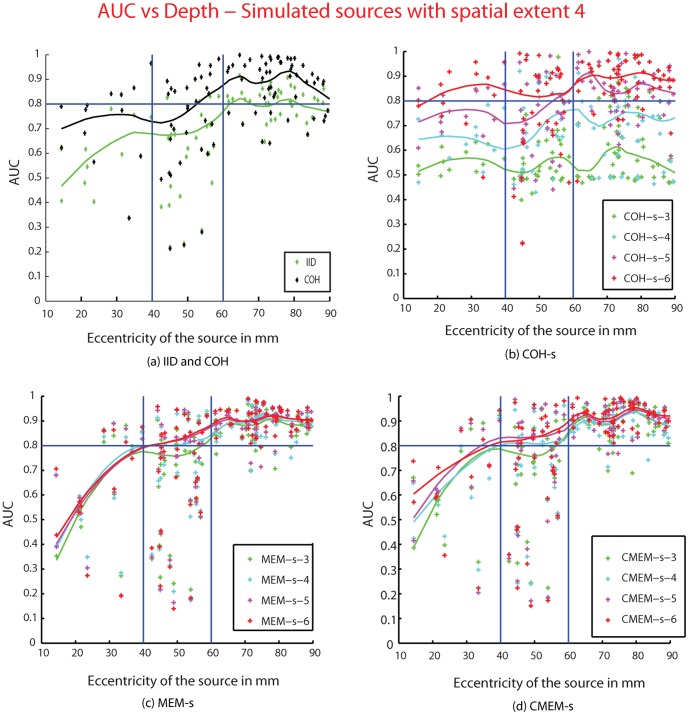
Figure 7. Effect of depth of the sources.
Plot showing AUC values as a function of the eccentricity (in mm) of the 100 simulated sources (with spatial extent se = 4). (a) IID (green), COH (black), (b) COH-s, (c) MEM-s, (d) CMEM-s. For the methods MEM-s, CMEM-s and COH-s, results for the different spatial clustering scale s are color coded as s = 3 (green), s = 4 (cyan), s = 5 (purple), and s = 6 (red). The solid lines are the moving average of the AUC values for the respective methods. Horizontal line, AUC = 0.8, Vertical lines: eccentricity = 40 mm and 60 mm.

