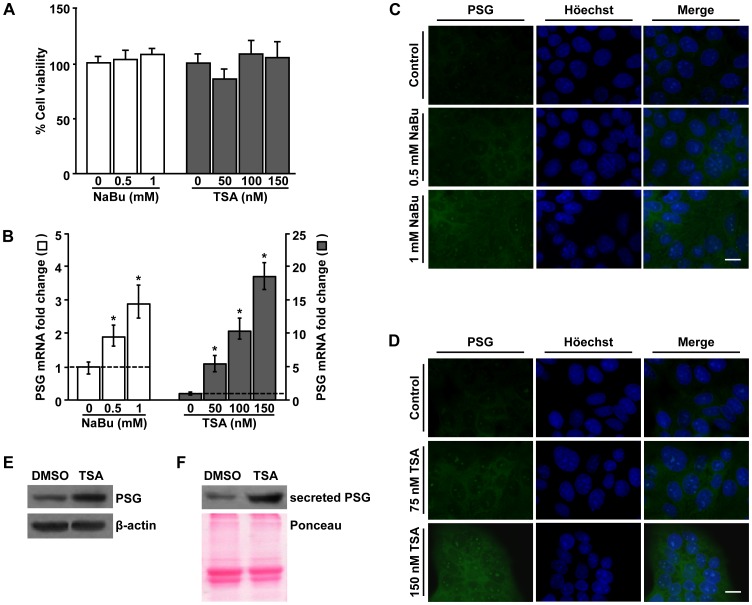
Figure 1. Total PSG protein and mRNA expression is stimulated by HDAC inhibitors.
A) JEG-3 cells were cultured in the presence of the indicated concentrations of NaBu (white bars), TSA (grey bars) or vehicle alone (0, control condition) for 18 h. MTT assay was used to determine cell survival. Results represent the mean ± SEM of three independent experiments performed in sixtuplicates and are shown as percentage respect to the non-treated cultures established as 100%. No statistically significant differences (p>0.05) compared to the control condition were detected. B) Total PSG mRNA levels were determined by real time RT-PCR (ABI 7500, Applied Biosystems) in JEG-3 cells cultured in the presence of the specified concentrations of NaBu (white bars) or TSA (grey bars) and in control cultures (0). Results were normalized to PPIA and expressed according to the 2–ΔΔCt method using as calibrator the mRNA level obtained from the corresponding control cultures. Data are presented as mean ± SEM of four independent experiments performed in triplicates. Significant differences were set at * p≤0.05, respect to control. C, D) Immunofluorescence of PSG (green, left panels) and nuclear staining with Höechst (blue, middle panels) in JEG-3 cells after treatment with the indicated amounts of NaBu (C), TSA (D) or vehicle (control). Right panels: merged images. Bar = 10 µm. Original magnification: 1000X. E, F) Western blot detection of PSG protein in JEG-3 cell total extracts (E) and secreted PSG levels in culture supernatants (F) after 150 nM TSA or DMSO exposure. β-actin (for PSG cellular content) and Ponceau staining (for secreted PSG) were used as loading normalizers. A representative experiment of two independent assays is shown.

