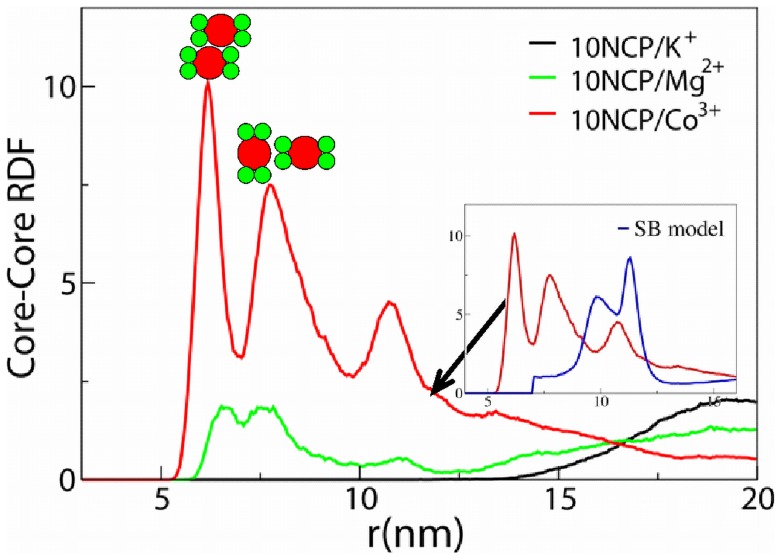
Figure 6. Radial distribution functions calculated for the centres of the NCP histone core.
Schematic representations of the NCP-NCP contacts are shown above the corresponding RDF peaks. In the insert, core-core RDF determined for the new coarse-grained NCP model in the 10NCP/Co3+ setup is compared with the RDF in the similar 10NCP/Co3+ system from our earlier work [28] where the histone core was modelled as single spherical particle (blue curve).

