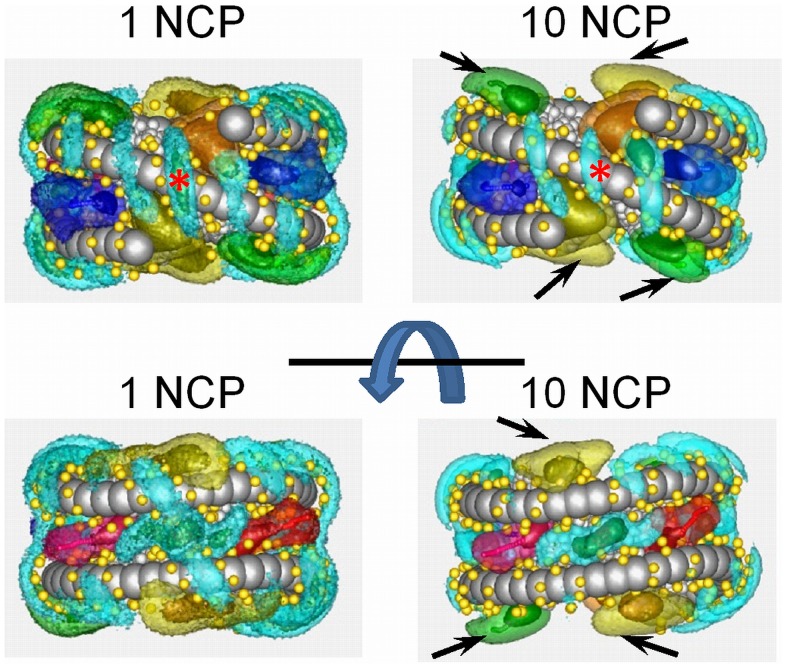
Figure 9. Comparison of SDFs calculated for the CoHex3+ (cyan) and internal histone tails in systems with one (two panels to the left) and ten NCPs (two right-hand side panels).
Arrows in the right panels indicate extension of the H2A (yellow) and H4 (green) tails outside the histone core and DNA due to NCP-NCP interaction in the 10NCP/Co3+ system. SDFs of the H2B and H3 tails are shown respectively in pink and blue colours; particles representing DNA and histone core are in light grey; phosphates are yellow. Red stars show position of the dyad axis.

