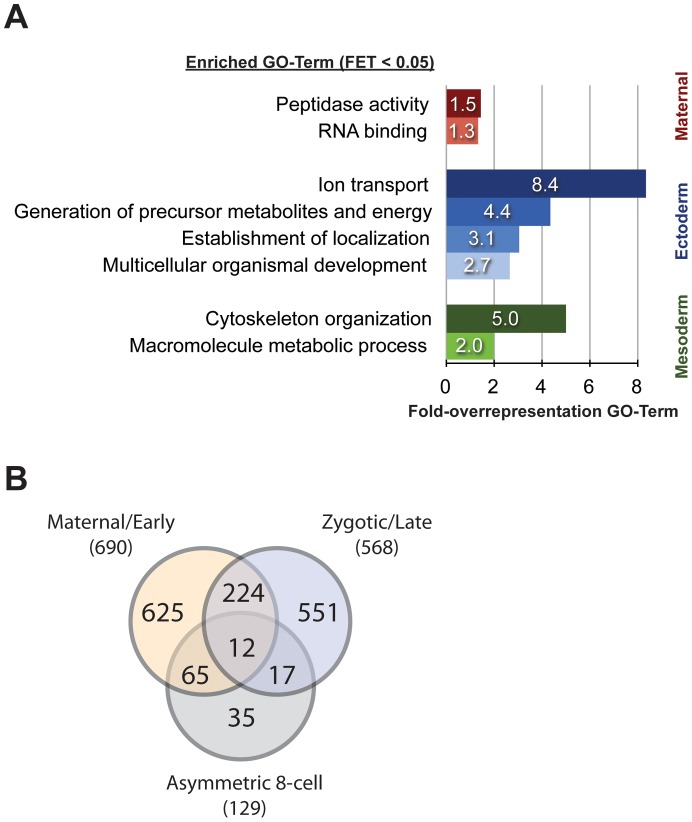
Figure 3. Asymmetrically distributed RNAs at the 8-cell stage of Parhyale.
(A) GO enrichment analysis for the asymmetrically distributed RNAs at the 8-cell stage of Parhyale, as well as for the maternally provided transcripts. The bars represent the GO-term fold-overrepresentation (percent of sequences in the analysed group associated to a certain GO-term over the percentage for this GO-term in the reference group) for significantly overrepresented GO-terms (Fisher’s Exact Test P-value less than 0.05) within the 690 maternally enriched targets (red bars), the 35 RNAs enriched in mesoderm progenitors (green bars) and the 33 ectoderm progenitor transcripts (blue bars). (B) A cross-correlation was performed between the data sets for (1) asymmetrically distributed RNAs at the 8-cell stage and (2) differentially expressed genes in transcriptionally inactive (pre-MZT) and transcriptionally active embryos. The left circle of the Venn diagram contains the 690 maternally enriched RNAs, 65 of which are asymmetrically distributed at the 8-cell stage (intersection with lower circle). The intersection of the left and right circles includes 236 targets expressed at equal levels during early and late embryonic development, with 12 being asymmetrically localized at the 8-cell stage. The right circle consists of the 568 genes predominantly expressed from the zygotic genome at later embryonic stages, including the 29 asymmetric at the 8-cell stage. There are 35 low-expressed RNAs, which are still showing statistically significant changes between the blastomeres of the 8-cell.

