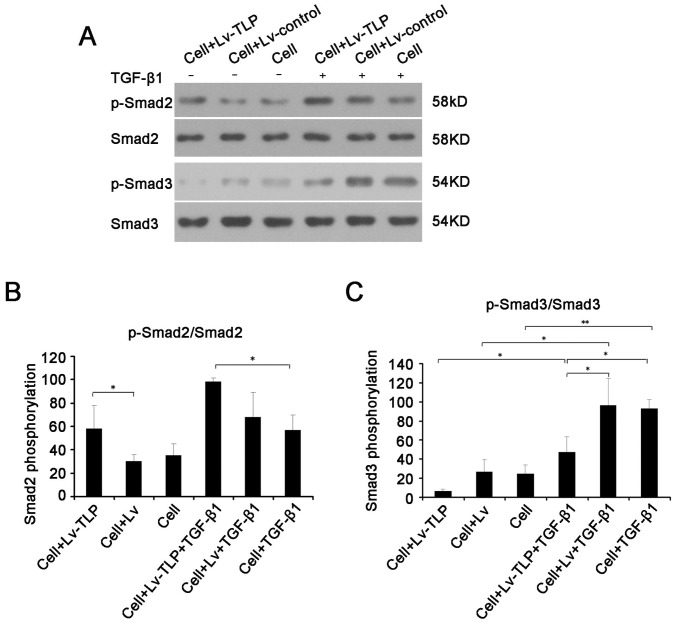
Figure 4. Western blot analysis demonstrates that TGF-β/Smad signaling changes after TLP overexpression.
(A) The changes in phosphorylation of Smad2 and Smad3. (B, C) Determination of grey value of pSmad2/Smad2 and pSmad3/Smad3. Results were shown as mean±SD of gray value. * means P<0.05 and ** means P<0.01 between two groups.

