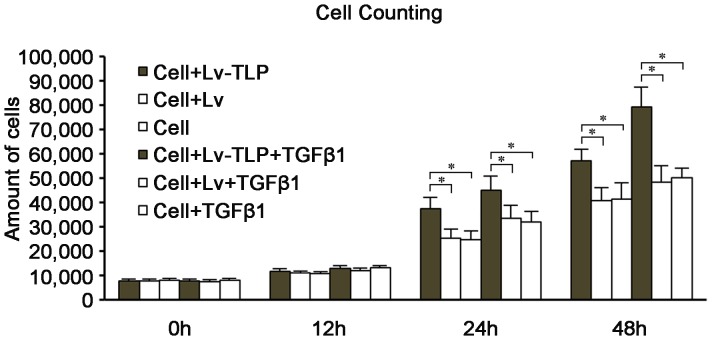
Figure 6. Variabilities of cell proliferation in different group over time.
The amount of HSFs were counted at the time points of 0 h, 12 h, 24 h, 48 h after being seeded into 96 plates. Values were expressed as the mean±SD (n = 5) P<0.05 compared to the groups of cell and cell-TGF-β1 using one-way ANOVA.

