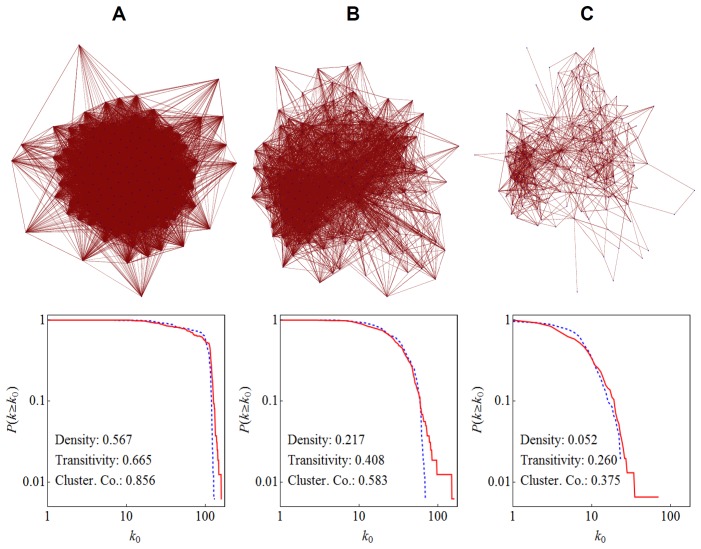
Figure 1. The social network in the junior class of Maine-Endwell High School at three different levels.
Top: Visualizations of networks. Nodes (blue dots) represent individual students. Links (thin red lines) represent their friendships reconstructed from results of the online survey administered in January 2011. Directions of links are omitted for clarity. These plots show the entire network (i.e., there were no disconnected nodes or components in our data). Bottom: Complementary cumulative degree distributions and other network metrics. Red solid lines are for out-degrees, while blue dashed lines for in-degrees. Densities and transitivities were calculated using directed links, while average clustering coefficients were calculated after converting all the links into undirected ones. (A) A network made of all levels of links (acquaintances, friends, and best or close friends). (B) A network made of links for friends and best or close friends only. (C) A network made of best or close friends only.

