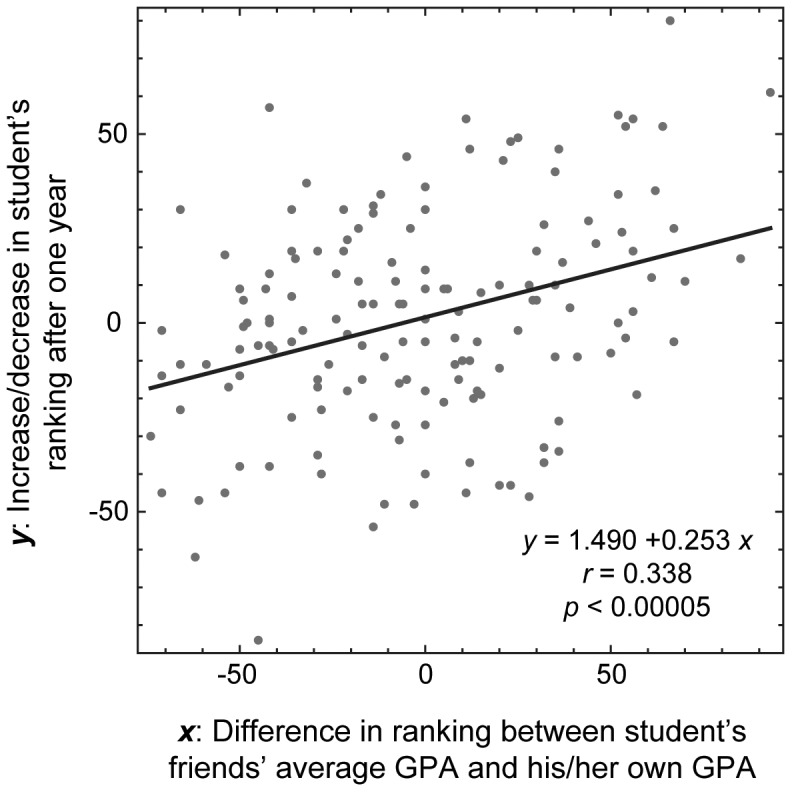
Figure 2. Positive correlation between the social network environment and the student’s academic progress over one year.

The horizontal axis represents the difference in ranking between a student’s friends’ average GPA and his/her own GPA (x = x friend). The vertical axis represents the increase/decrease in the student’s ranking after one year (y). Each dot represents data from one student.
