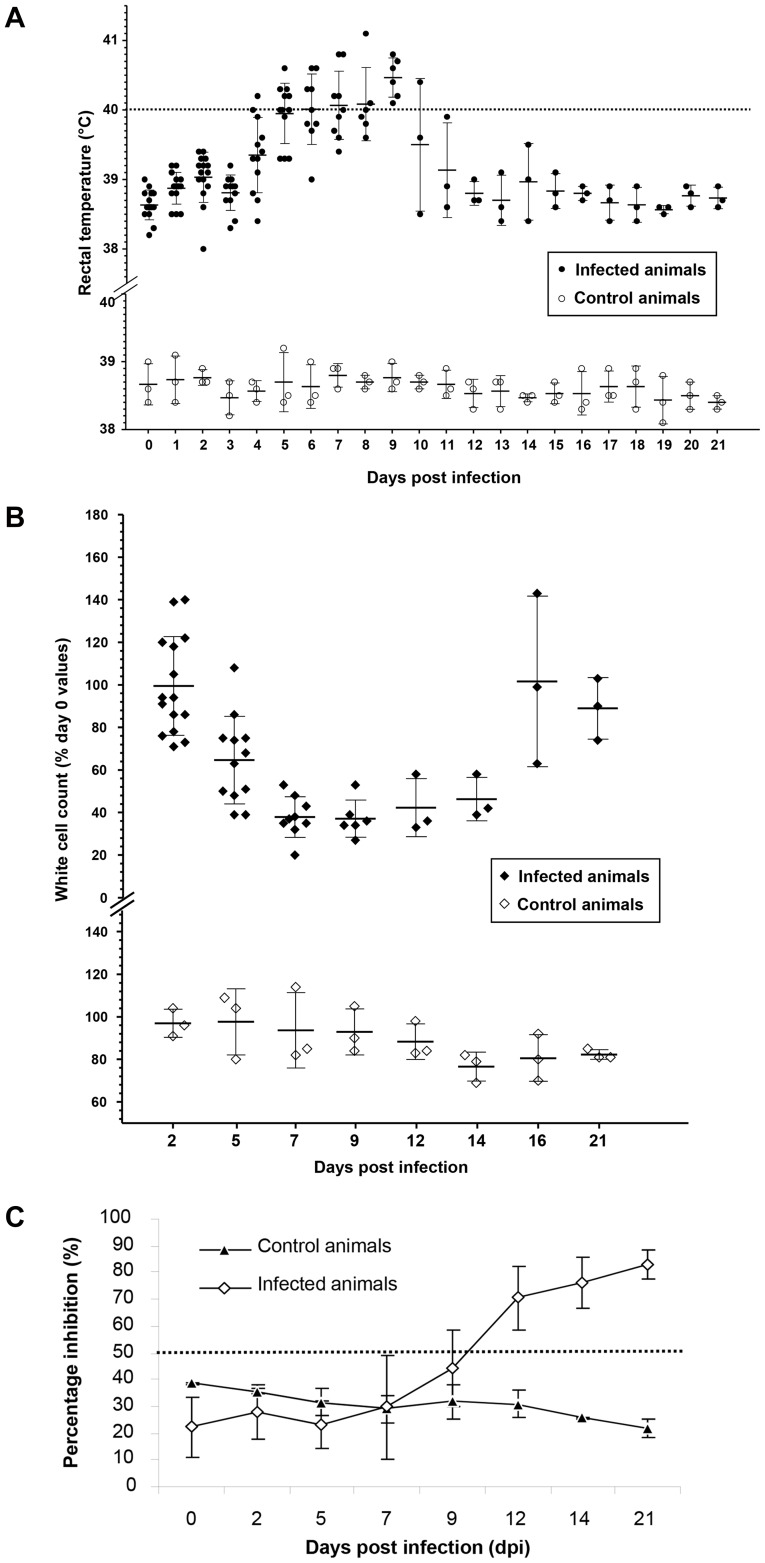
Figure 2. Clinical monitoring and serological response following infection with the PPRV CI/89 strain. a).
Average rectal temperatures of goats infected with PPRV CI/89. The dashed dotted line indicates the temperature cut-off value above which animals were considered pyrexic (39.5°C). Average values are plotted for infected (n = 15) against control (n = 3) animals with standard deviation around the mean being shown. Animal numbers reduce in line with the staggered euthanasia performed; b) Infection induced leucopaenia following infection with PPRV CI/89. PBL counts are expressed as a percentage change from the three-day, pre-challenge average of each goat’s PBL counts. Mean values and standard deviation is shown at each time point (Day 0 PBL counts taken as 100%); c) Serological responses following inoculation with the PPRV CI/89 strain in the animals that remained at the end of the study (n = 3). The PI cut off value for seropositivity is denoted by a dotted line.

