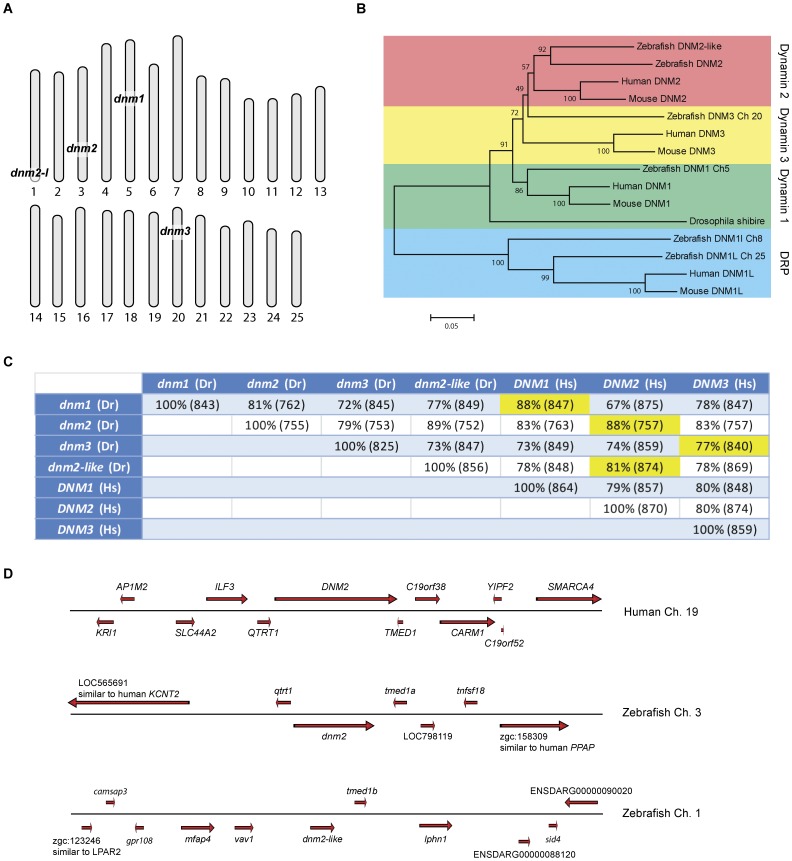
Figure 1. Phylogenetic and syntenic analysis of dnm2 and dnm2-like.
(A) Chromosomal locations of zebrafish homologues to human DNM1, DNM2 and DNM3. (B) Phylogenetic tree comparing dynamin-2 genes in multiple species. (C) Comparison of zebrafish classical dynamins with human classical dynamins. Percent identity was determined by BLASTP. The length of homologous overlap is in parenthesis (number of amino acids). (D) Syntenic organization of human DNM2 compared with zebrafish dnm2 and dnm2-like.

