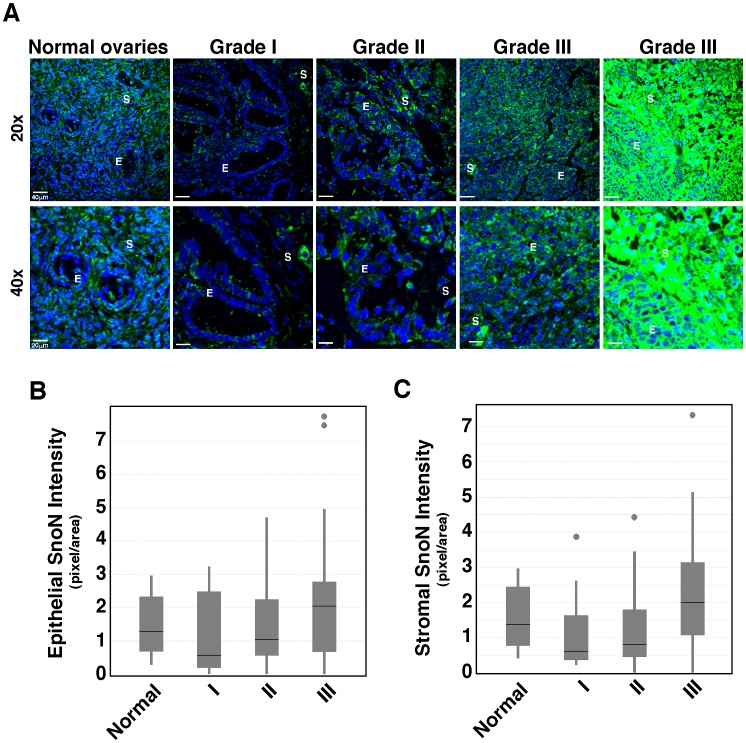
Figure 3. SnoN expression in ovarian adenocarcinoma.
A, Representative SnoN expression in the normal ovarian tissue and in ovarian adenocarcinoma of various tumor grades at 20X (top) or 40X (bottom) magnifications. Two grade III samples representing different levels of SnoN expression were shown. E: epithelium; S: stroma. Green: SnoN; blue, DAPI. B, SnoN staining in normal and ovarian tumor epithelial cells was quantified using Image J software and the numbers were plotted in the box plot, which includes normal samples (n = 10, mean = 1.28) and ovarian tumor samples of grade I (n = 11, mean = 0.55), stage II (n = 29, mean = 1.05), and stage III (n = 25, mean = 2.04). Statistical analysis comparing the normal controls to each tumor grade showed that the epithelial SnoN levels in ovarian adenocarcinoma are equal or weaker than the control tissue samples: p = 0.6139 for grade I, p = 0.7984 for II, and p = 0.1461 for III. No significant difference was observed between the ovarian tumor samples. C, SnoN staining in stromal cells in normal samples (n = 10, mean = 1.38) and ovarian tumor samples of grade I (n = 7, mean = 0.61), II (n = 23, mean = 0.81), and III (n = 20, mean = 2.00). The statistical analysis comparing the normal controls to each ovarian tumor grade is as follow: p = 0.5997 for grade I, p = 0.3633 for grade II, and p = 0.1833 for grade III. The increase in stromal SnoN expression in grade III compared to grade II (p = 0.0258) was statistically significant.

