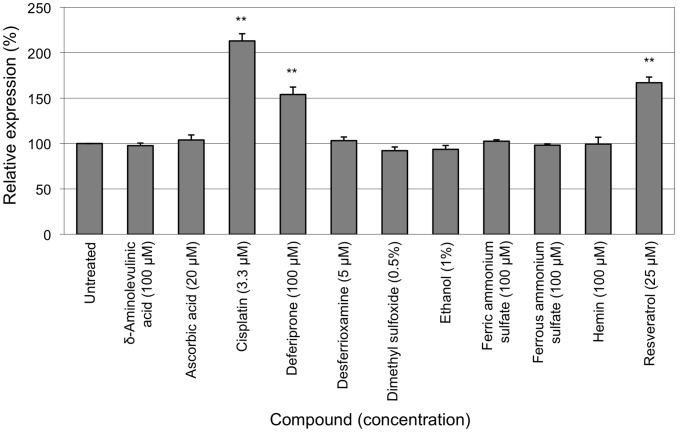
Figure 2. Primary compound screen.
The HeLa (FXN-EGFP) stable cell line was exposed to various concentrations of selected test compounds for 72 hours. The levels of EGFP expression were measured by flow cytometry. For each compound the lowest concentration that produced the greatest change in FXN-EGFP expression is shown. Assays were performed in triplicate on at least three independent occasions. Error bars represent standard error of the mean. **p<0.01 in comparison to the untreated control.

