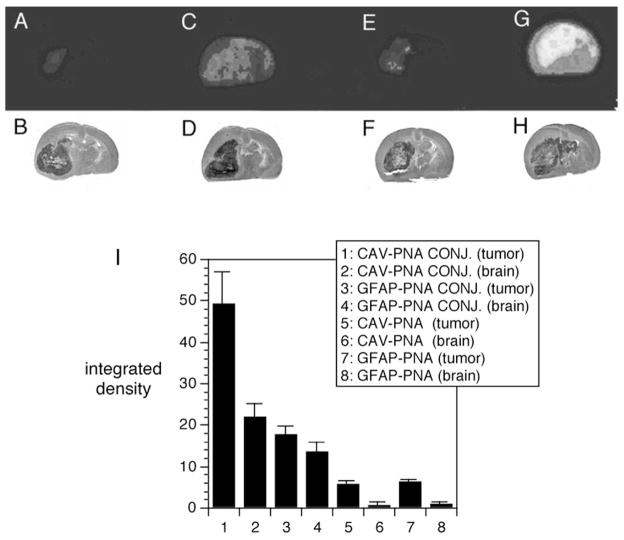
Figure 7.
(A, C, E, G) Colorized film autoradiograms of sections removed from Fisher CD344 rat brain implanted with RG2 tumors; the rats were sacrificed at six hours after intravenous injection of [111In] PNA against either the rat caveolin-1α (CAV) or rat glial fibrillary acidic protein (GFAP) mRNA. (A) RG2 tumor-bearing rat injected with unconjugated [111In]-GFAP-PNA. (C) RG2 tumor-bearing rat injected with [111In]-GFAP-PNA conjugated to the OX26 TfRMAb. (E) RG2 tumor-bearing rat injected with unconjugated [111In]-CAV-PNA. (G) RG2 tumor-bearing rat injected with [111In]-CAV-PNA conjugated to the OX26 TfRMAb. (B, D, F, H) Hematoxylin autopsy stains showing size of tumor and corresponding to panels A, C, E, and G, respectively. (I) Integrated density of the autoradiogram signal over the brain tumor (tumor) or contralateral brain (brain) for each of the four different antisense radiopharmaceutical formulations: 1,2: [111In]-CAV-PNA OX26 conjugate (CAV-PNA CONJ.); 3–4: [111In]-GFAP-PNA OX26 conjugate (GFAP-PNA CONJ.); 5–6: unconjugated [111In]-CAV-PNA (CAV-PNA); 7–8: unconjugated [111In]-GFAP-PNA (GFAP-PNA). Data are mean ± S.E. (n = four rats in each of the four groups). From [43].

