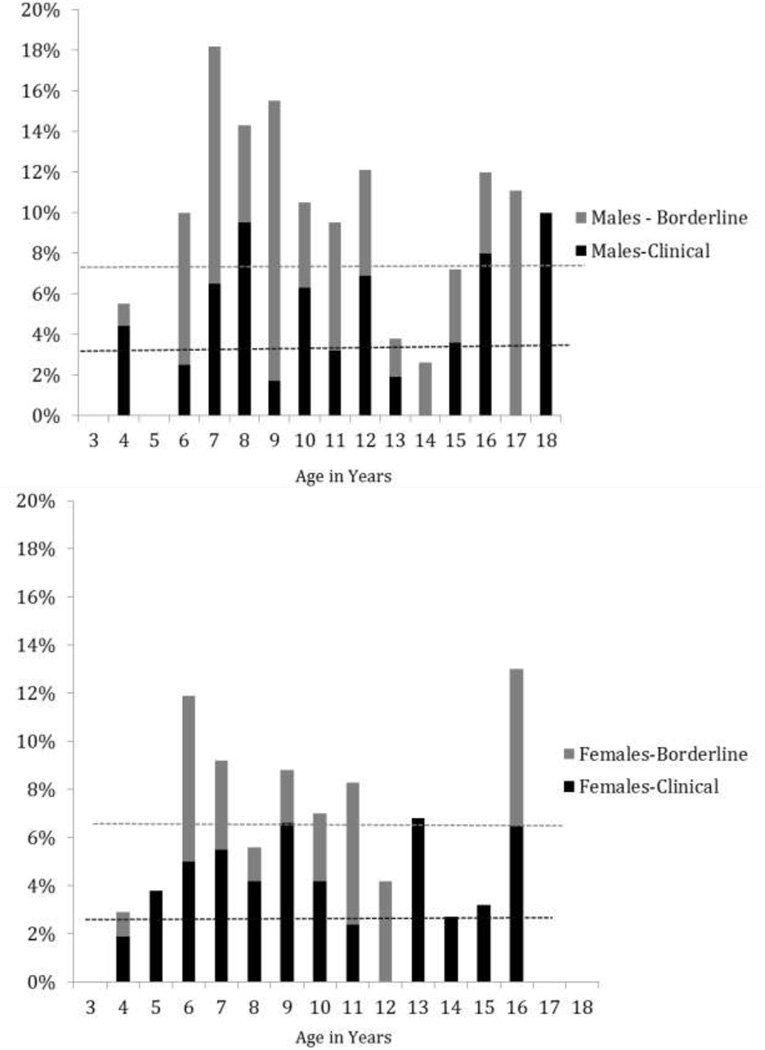
Figure 1.
The percentage of males (1a) and females (1b) at each age falling above the borderline and clinical cutoffs. The black dotted line represents the percentage of children expected to fall above the clinical cutoff. The gray dotted line represents the percentage of children expected to fall above the borderline cutoff.

