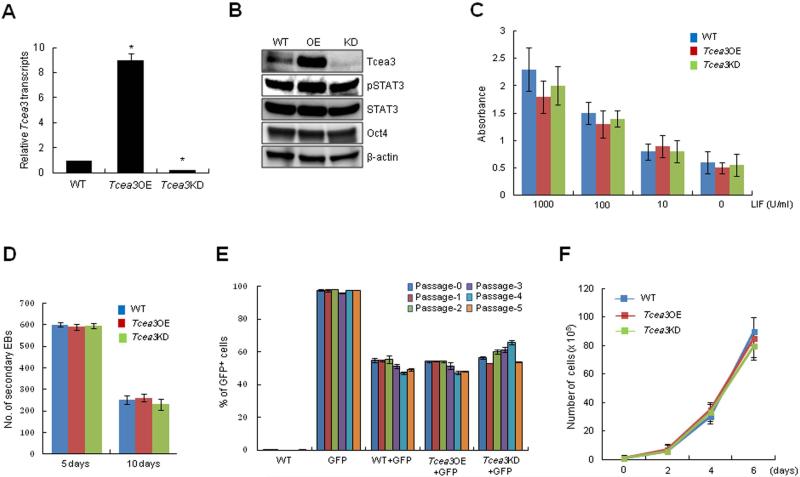
Figure 2. Altered expression levels of Tcea3 do not affect self-renewal of mESCs.
(A) Tcea3 transcript levels were analyzed by realtime RT-PCR. (B) Protein expression of Tcea3, Oct4, and p-Stat3 was analyzed by immunoblot using cell extracts from WT, Tcea3 OE, and KD mESCs. (C) WT, Tcea3 OE and Tcea3 KD mESCs were maintained in different concentrations of LIF for 5 days and AP activity was measured. (D) 1st EBs from indicated cells were dissociated into single cells and re-seeded at a density of 1 × 10⁶ cells/ml in the same medium. The number of 2nd EB colonies was counted under light microscope. (E) GFP-positive (GFP+) mESCs were mixed at a ratio of 1:1 with GFP-negative (GFP-) WT, Tcea3 OE, and Tcea3 KD cells, respectively. The GFP+/GFP- ratios were measured at each passage. (F) Cell proliferation of WT, Tcea3 OE and Tcea3 KD mESCs was analyzed by counting cell number every 2 days under ESC culture condition. All values are means ± s.d. from at least triplicate experiments. * indicates significant (P<0.05) results based on Student's T-test analyses.

