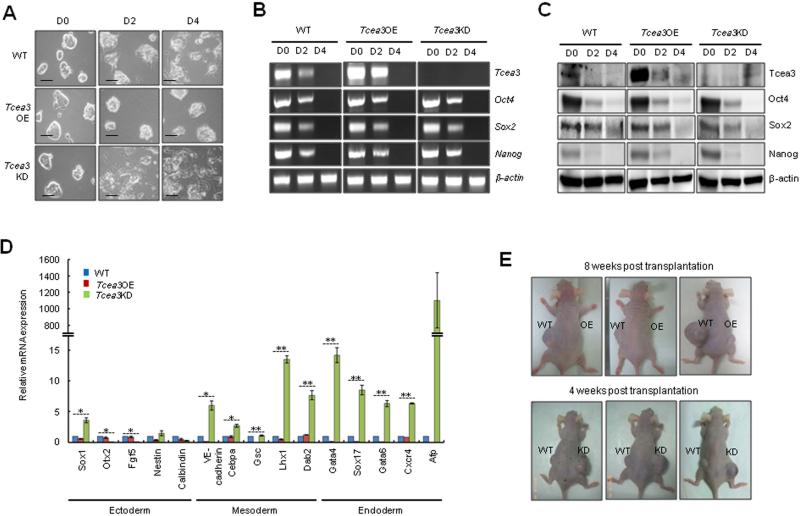
Figure 3. Altered expression of Tcea3 influences multi-lineage differentiation potential of mESCs both in vitro and in vivo.
(A) In vitro differentiation was induced by removing LIF and adding RA to WT, Tcea3 OE, and KD mESCs. Cells were examined at day 0 (D0), day 2 (D2) or day 4 (D4) following in vitro differentiation. Scale bar = 100 μm. (B) RT-PCR analysis of Tcea3, Oct4, Sox2 and Nanog expression during in vitro differentiation of WT, Tcea3 OE, and KD mESCs. (C) Immunoblot analysis of Tcea3, Oct4, Sox2 and Nanog expression during in vitro differentiation of WT, Tcea3 OE, and KD mESCs. (D) WT, Tcea3 OE, and KD mESCs differentiated for 4 days (RA-d4) were analyzed for the expression of markers representing ectoderm, mesoderm and endoderm by real-time RT-PCR. The expression level of each gene was shown as relative value following normalization against that of the glyceraldehyde 3-phosphate dehydrogenase (Gapdh) gene. (E) WT, Tcea3 OE and Tcea3 KD cells were injected into NOD/SCID mice and teratoma development was examined. Teratoma formation of Tcea3 OE cells was compared with that of WT cells 8 weeks after injection and teratoma formation of Tcea3 KD cells was compared with that of WT cells 4 weeks after injection. This teratoma analysis was repeated twice with identical results (data not shown).
All values are means ± s.d. from at least triplicate experiments. * indicates significant(P<0.05) and ** highly significant (p<0.01) results based on ANOVA analyses following the Scheffe test.

