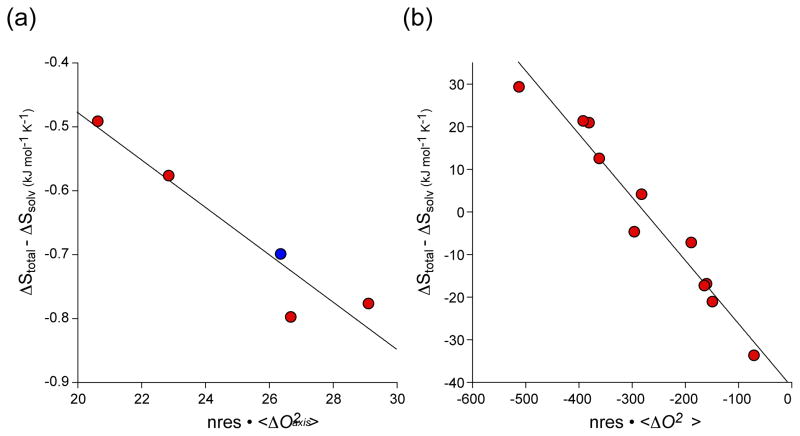
Figure 3.
Calibration of the dynamical proxy for protein conformational entropy. (a) The binding ofcalmodulin -binding domains to calcium saturated calmodulin [21**]. Order parameters derived from deuterium methyl relaxation in calmodulin and the target domains. Red symbols represent wild-type calmodulin binding to four different target domains. The blue symbol corresponds to a complex involving the E84K mutant of calmodulin. The data givea linear regression statistic R of 0.95and a slope (m) of−0.037 ± 0.007 kJ K−1 mol res−1that allows for empirical calibration of the conversion of changes in side-chain dynamics to a quantitative estimate of changes in conformational entropy. (b) The binding of DNA to activated CAP [23**]. The wild-type and mutant CAP proteins ligated with cAMP or cGMP were studied. Order parameters were derived from cross-correlated 13C-1H relaxation in CAP. The data givea linear regression statistic R of 0.98 and aslope (m) of −0.15 ± 0.01 kJ K−1mol res−1.

