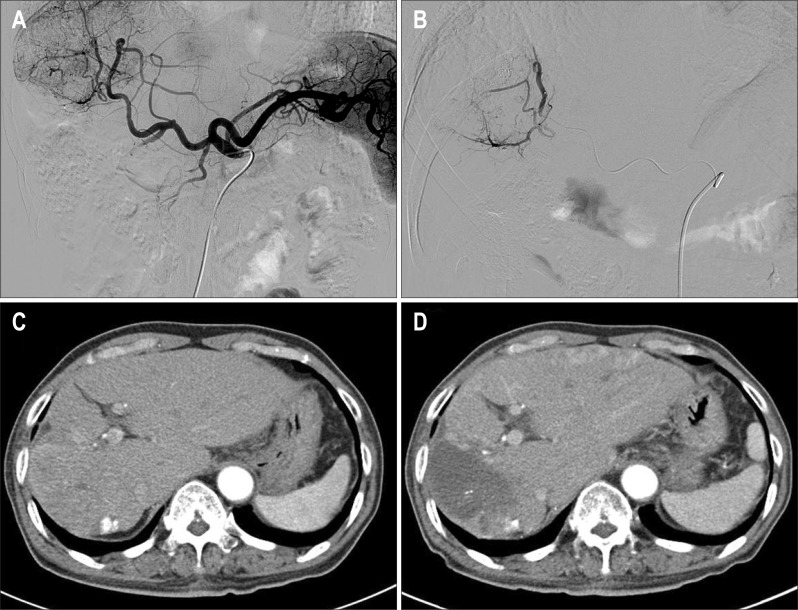
Fig. 1.
The representative angiogram of regular enhancement pattern (A, B) and treatment outcome (C, D) (Patients number 6). (A) Arterial stain in angiography of celiac trunk. (B) Selection of feeding artery and embolization using DC beads. (C) Computed tomography (CT) imaging before treatment with DC beads. (D) CT imaging after treatment with DC beads (partial response by modified Response Evaluation Criteria in Solid Tumors).

