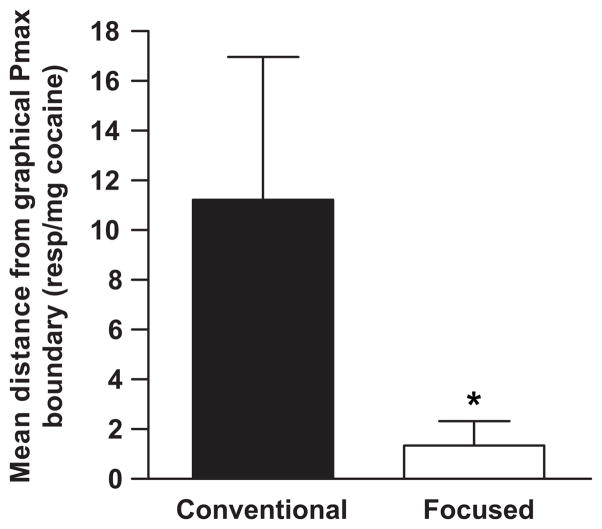
Fig. 5.
Comparison of accuracy of conventional vs. focused demand curve fitting that takes into account a ±1 price point error in the estimation of graphical Pmax. Distance from Pmax boundary is the magnitude of the distance in units of price of the calculated Pmax to ±1 price point from graphical Pmax; *p < 0.05.

