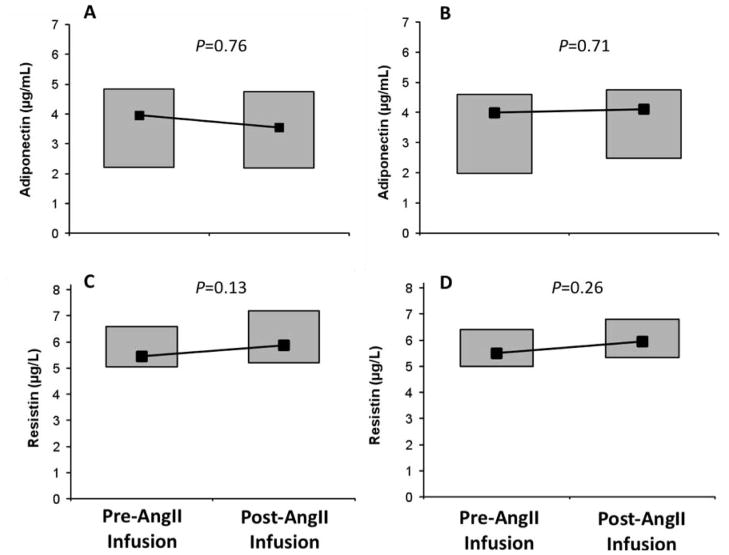
Figure 1.
Changes in adiponectin in response to low-dose AngII infusion before (A) and after (B) vitamin D3 therapy, and changes in resistin in response to low-dose AngII infusion before (C) and after (D) vitamin D3 therapy. Box plots depict the 25th–75th percentile (grey boxes) and the median (black square).

