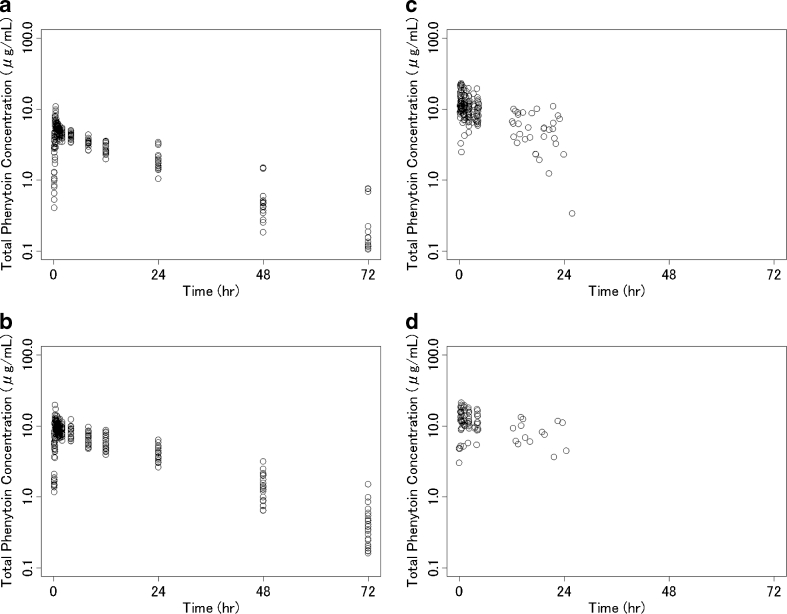
Fig. 2.
Total plasma phenytoin concentrations obtained from clinical studies. a Healthy volunteers (n = 12) in a Phase I study (study in which phenytoin sodium and fosphenytoin sodium were administered). b Healthy volunteers (n = 12) in a Phase I study (dose-escalation study). c Pediatric patients (n = 33) in a Phase III study. d Adult patients (n = 14) in a Phase III study

