
Fig. 2.
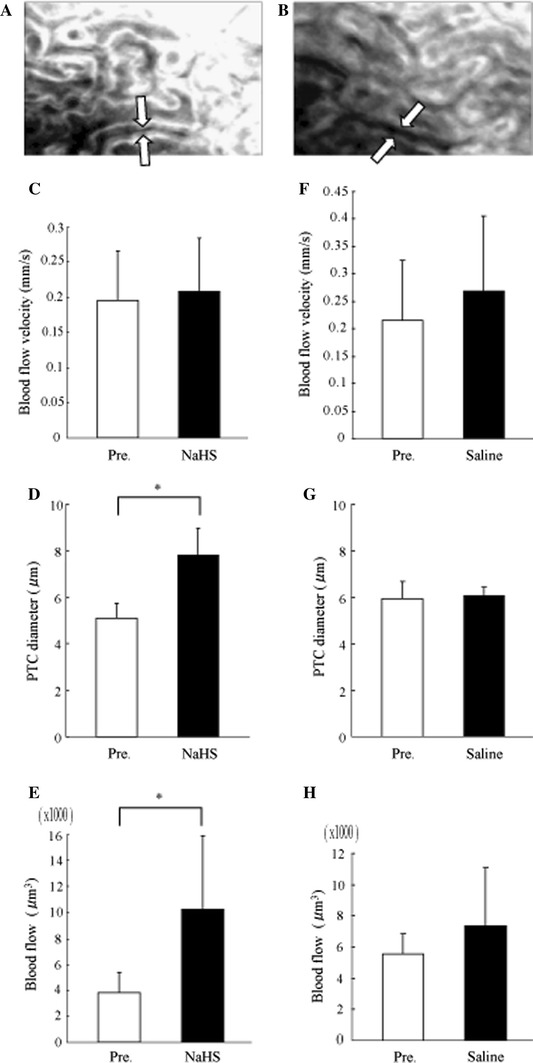
In-vivo effects of NaHS and saline loading in the nTg kidney. PTC images by an intravital video CCD camera at pre- (a) and post- (b) injections of 56 mg/kg body weight NaHS. The post-injection image was taken 1 min after the NaHS injection. White arrows show PTC. While PTC blood flow velocity (c) was not affected by the NaHS administration, PTC diameter (d) and blood flow (e) were increased. On the other hand, isovolume saline loading did not alter PTC blood flow velocity (f), its diameter (g) and blood flow (h). Data are shown as the mean (columns) and SD (bars). *P < 0.01, n = 5