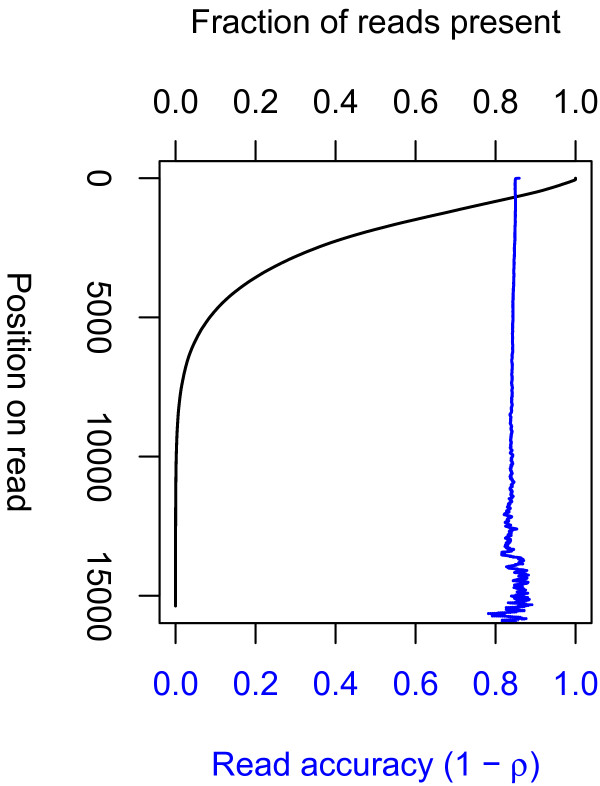
Figure 7.
Statistics of reads fromE. coliO104:H4 produced by the PacBioRSsequencing platform. (Black) The fraction of reads with length at least x. This is roughly the survival curve of an exponential distribution. (Blue) The fraction of reads (of length at least x) that are correct at position x. Accuracy is nearly position independent, so the blue curve is roughly the constant 1−ρ, where ρis the error rate per position.

