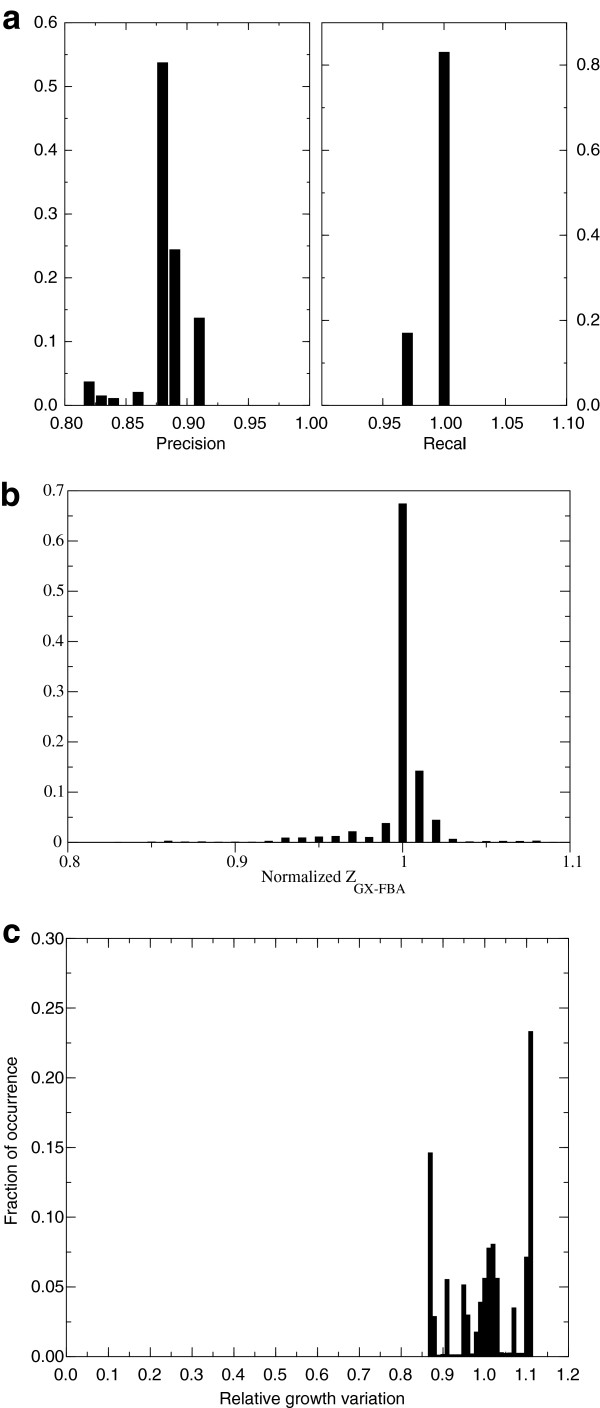
Figure 2.
Assessment of GX-FBA method using experimental data on yeast metabolism. Distribution of GX-FBA predicted quantities in response to 25,000 random samples of degenerate FBA optimal states: a) Precision and recall of GX-FBA predictions, b) maximal ZGX-FBA objective function, and c) maximal biomass production flux (b) and c) normalized to peak values.

