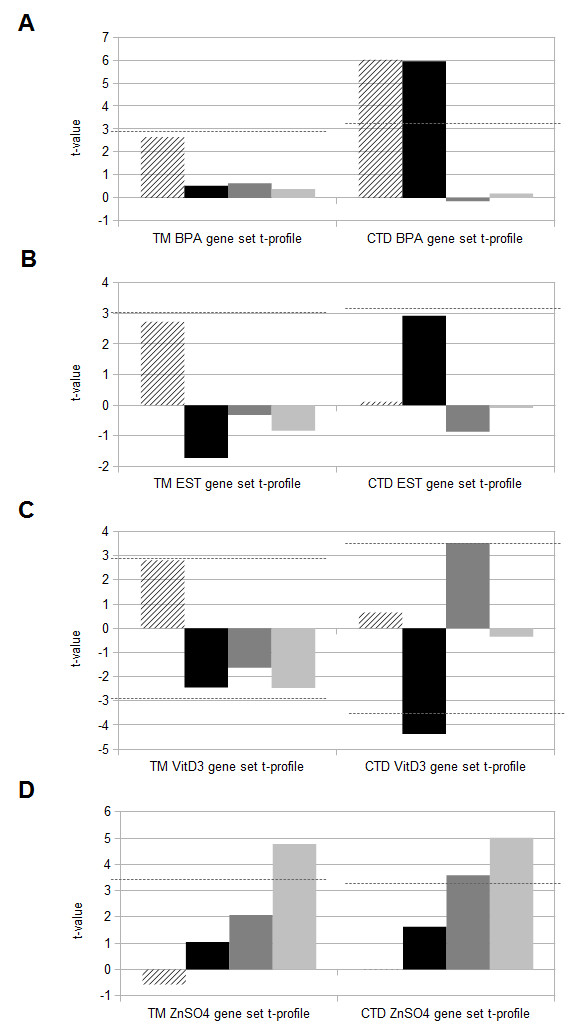
Figure 2.

T-profiles of human gene sets. T-profiles of the CTD-based and next-gen TM-based BPA human gene sets (A), the Estradiol (EST) human gene sets (B), the VitD3 human gene sets (C), and the ZnSO4 human gene sets (D) for the BPA (striped bar), ESThsa (black bar), VitD3 (dark gray bar) and ZnSO4 (light gray bar) human gene expression data sets. The dotted line represents the border of significant t-values.
