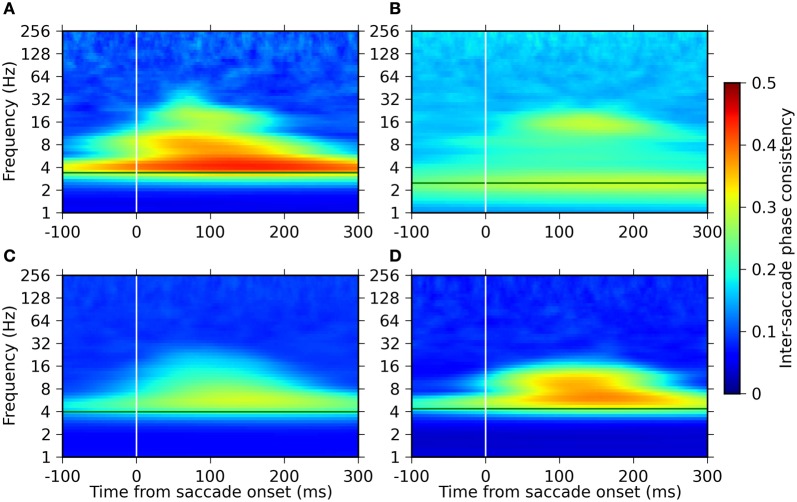
Figure 4.
Time-frequency plots of the inter-saccade phase consistency around saccade onset for the four monkeys. Panels (A–D) represent the results of monkeys D, S, M, and G, respectively. The green horizontal lines indicate the saccade frequencies of the individual monkeys. The strength of the ISPC is indicated in a pseudo-color code (color bar on the right).

