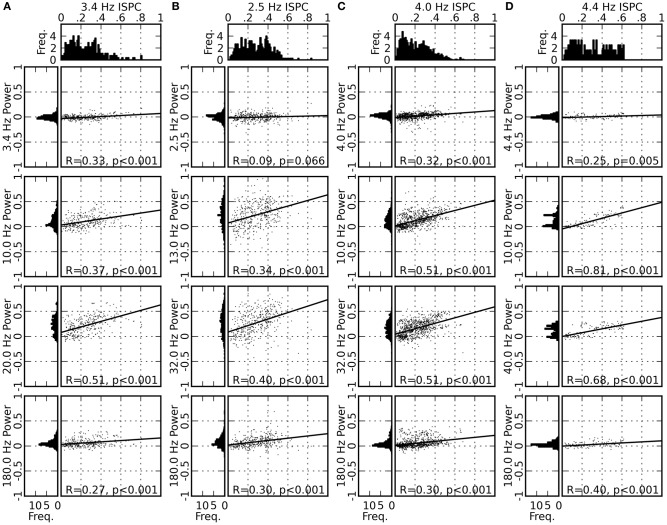
Figure 6.
Distribution of the ISPC values for the delta-theta band (top panels), distribution of the normalized LFP power for four frequency bands (left columns; same normalization as in Figure 3), and scattergrams of the ISPC and the LFP power values for all pairings of the four frequency bands (right columns). The horizontal and vertical position of a single dot in a scattergram represent the delta-theta ISPC value and the LFP power in the corresponding frequency band, respectively, obtained from the data from one recording site in one of the experimental sessions. Results from all recording sites in all experimental sessions are plotted altogether. The solid line represents the linear regression of the data points, with its correlation coefficient (R-value) and the p-value marked at the bottom (see “Materials and Methods” for methodological details). Panels (A–D) represent the results for monkeys D, S, M, and G, respectively.

