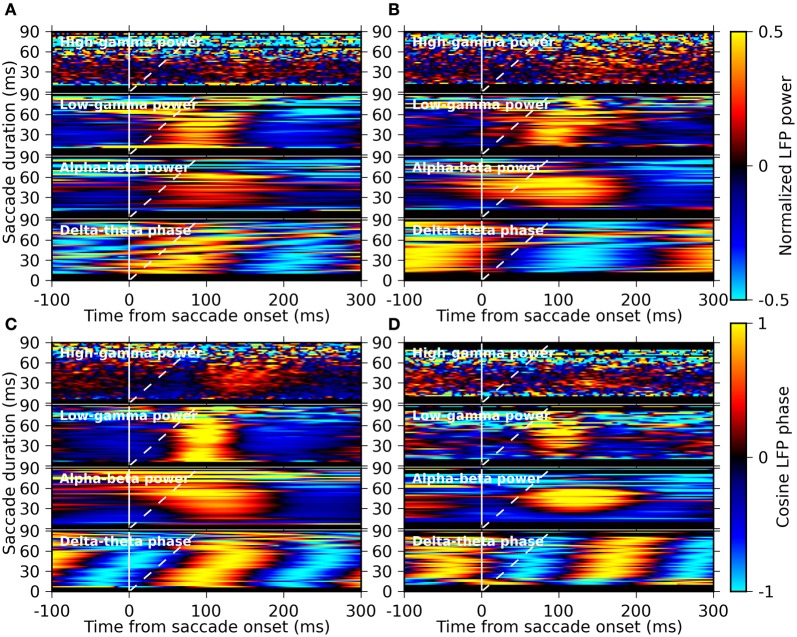
Figure 7.
Saccade-duration resolved plots of the average LFP phase and average LFP power in different frequency bands triggered on saccade onset. Panels (A–D) represent the results for the monkeys D, S, M, and G, respectively. In each panel, the average phase of the delta-theta band component and the average power of the alpha-beta, the low-gamma, and the high-gamma frequency components are shown from bottom to top, respectively. The averages were computed separately for sets of saccades with different saccade durations (bin width: 2 ms), constituting the y-axis of each plot in pseudo-color (color bars on the right). The solid and dashed white lines indicate the timing of saccade-onset and fixation-onset, respectively, at each vertical position within each plot.

