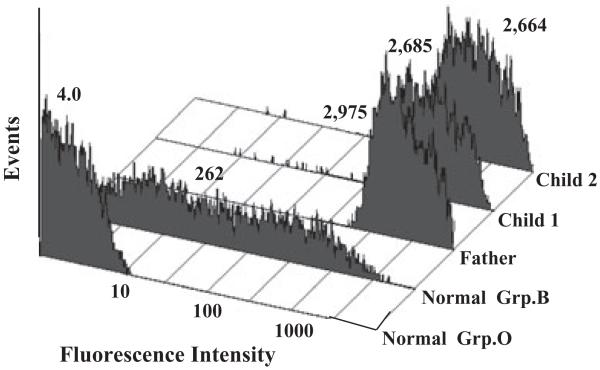
Fig. 4.
B antigen was strongly expressed on PLTs from the father and the two group B children affected with NAIT. The anti-B MoAb BGRL2 was used to measure B antigen expression. Reactions of BGRL2 with normal group O and B PLTs are shown in the first two flow cytometry histograms. Values above each histogram indicate MFI of the PLT population

