
Fig. 1.
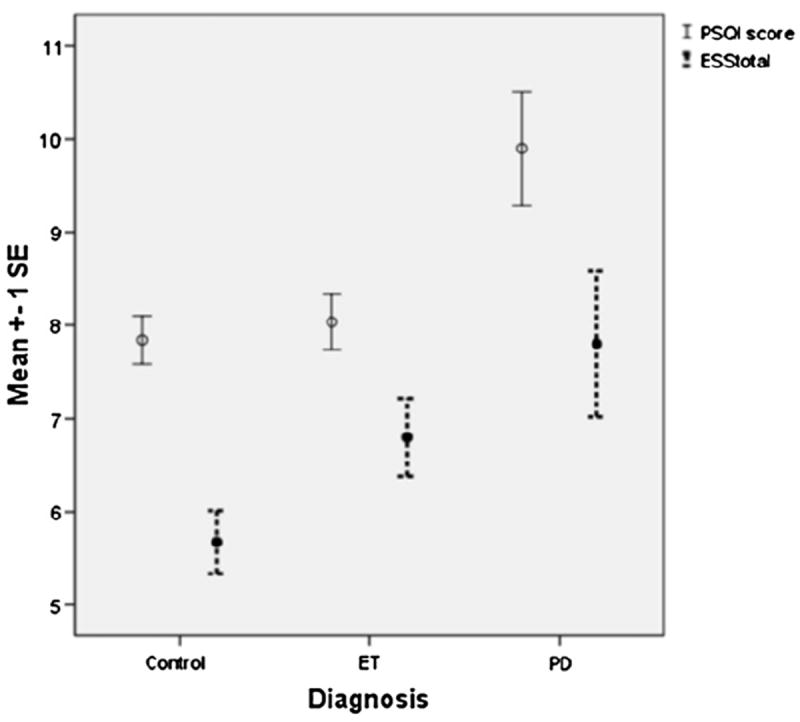
PSQI and ESS scores in Normal Controls, ET cases, PD cases. Circles represent the sample mean. The vertical lines indicate ±1 deviation of standard error from the mean.
Official websites use .gov
A
.gov website belongs to an official
government organization in the United States.
Secure .gov websites use HTTPS
A lock (
) or https:// means you've safely
connected to the .gov website. Share sensitive
information only on official, secure websites.
PSQI and ESS scores in Normal Controls, ET cases, PD cases. Circles represent the sample mean. The vertical lines indicate ±1 deviation of standard error from the mean.