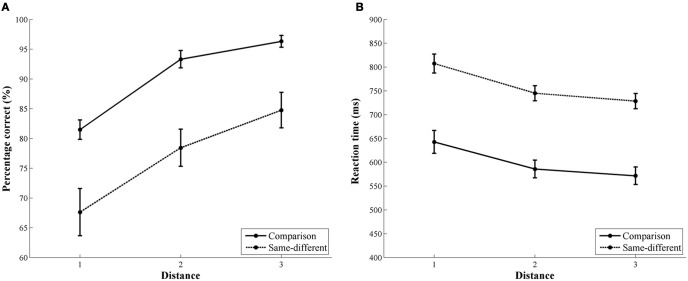
Figure 2.
Behavioral results of the comparison and the same-different task. The left image (A) represents the accuracy rate for the comparison (solid line) and the same-different task (dotted line). The right image (B) represents the reaction time data for the comparison (solid line) and the same-different task (dotted line). For both tasks, a distance effect was present in accuracy and reaction time.

