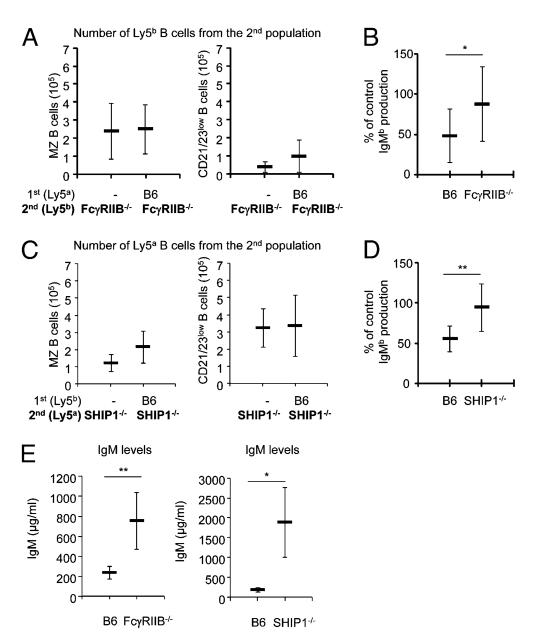
FIGURE 4.
Role of the FcRγIIB and SHIP1 in feedback regulation of IgM production. (A) The number of MZ CD21highCD23low (left panel) and CD21lowCD23low (right panel) B cells recovered from the second FcRγIIB−/− Ly5b IgHb cell population when injected alone or into mice injected 4 wk before with a first Ly5aIgHa WT population. Each bar represents the mean ± SD of values for 12–14 mice. Note that the number of CD21highCD23low and CD21lowCD23low cells present among the second set of B cells was not modified by the presence of a first set of B cells. (B) The IgMb titers produced by a second population of WT (left) or FcRγIIB-deficient (right) B cells transferred into Rag-deficient mice injected 4 wk before with cells from WT IgHa donors expressed as a percentage of the control levels obtained after their transfer into naive Rag-deficient hosts. Note that the IgMb production by FcRγIIB-deficient B cells was not inhibited in the presence of a first population of WT B cells. Each bar represents the mean ± SD of values for 12–14 mice. Data shown were pooled from two independent experiments. (C) The number of MZ CD21highCD23low (left panel) and CD21lowCD23low (right panel) B cells recovered from the second SHIP1−/− Ly5aIgHb population when injected alone (left) or into mice injected 4 wk before with a first Ly5bIgHa population. Each bar represents the mean ± SD of values for 12–14 mice. Note that the number of Ly5a CD21highCD23low and CD21lowCD23low cells present among the second set of B cells was not modified by the first set of B cells. (D) IgMb levels produced by a second population of WT (left) or SHIP1-deficient (right) B cells transferred into Rag-deficient mice injected 4 wk before with cells from WT IgHa donors expressed as a percentage of the control levels obtained after their transfer into naive Rag-deficient hosts. Note that the IgMb production by SHIP1-deficient B cells was not inhibited in the presence of a first population of WT B cells. Each bar represents the mean ± SD of values for 12–14 mice. Data shown were pooled from two independent experiments. (E) The left panel shows the IgM concentrations present in the serum of age-matched WT littermates and FcRγIIB−/− mice. Each bar represents the mean ± SD of values for eight mice. IgM titers in the mutant mice were significantly higher. The right panel shows the IgM concentrations present in the serum of age-matched WT littermates and SHIP1−/− mice. Each bar represents the mean ± SD of values for four mice. IgM titers in the mutant mice were significantly higher. *p < 0.05, **p < 0.01.

